How-to guides
- You are new to PRTG? Then you've come to the right address!
- Our how-to guides will help you to have an easy start and get the most out of PRTG
- Practical step-by-step guides explain the most common functions


PRTG Enterprise Monitor in an offline environment
In this how-to guide, you will learn how to use Paessler PRTG Enterprise Monitor in an offline environment ➤ Get started with our 5-step guide.
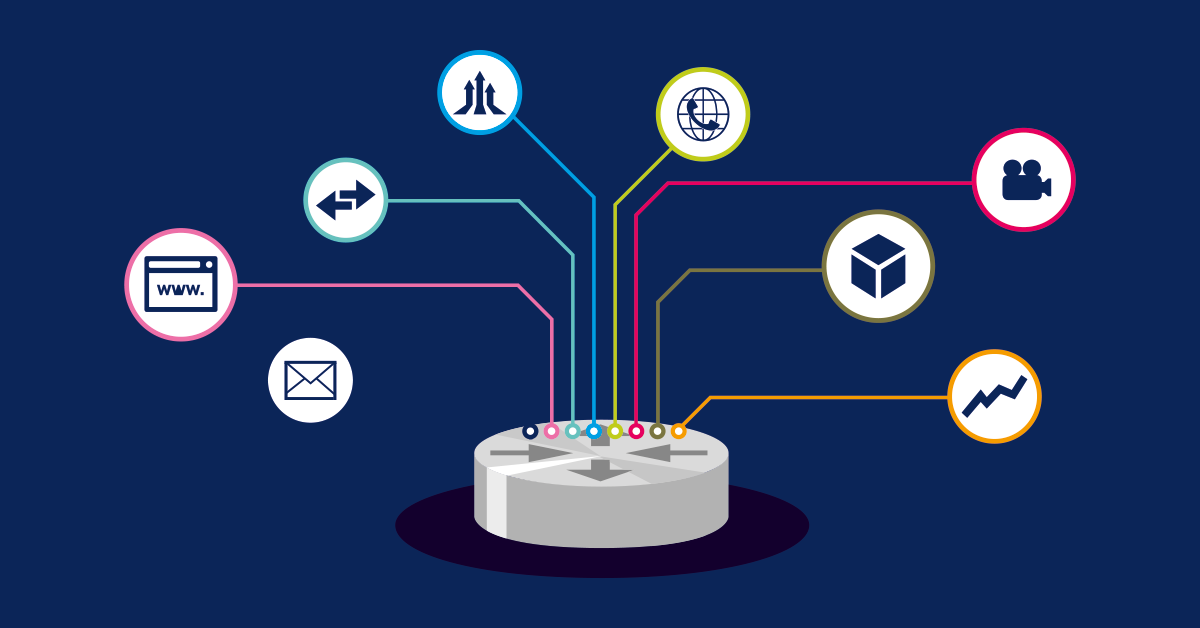
Syslog and SNMP trap messages
You can deploy PRTG as a kind of syslog server and SNMP trap receiver. In this how-to guide, we will provide you with an example of how to set up syslog and SNMP trap message monitoring.

Email round trips
PRTG provides different sensors for email round trip monitoring to monitor the end-to-end delivery process of an email from sending it to retrieving it.

HTTP push monitoring
Push monitoring via HTTP means to monitor data that a device automatically sends to PRTG with the help of different HTTP Push sensors. In this how-to, we show you how to set up HTTP push monitoring.
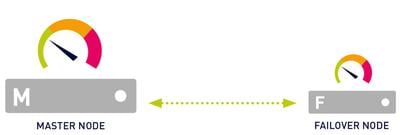
How to set up a failover cluster in PRTG in 6 steps
PRTG comes with a built-in failover cluster for high-availability monitoring. In this how-to guide, we show you how you can set up a single failover cluster in 6 steps.
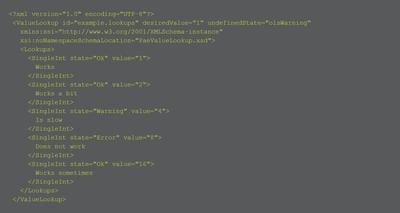
How to work with lookups in PRTG
PRTG uses lookups for the channels of some sensors to define the status that a sensor shows, just like sensor limits do. This how-to guide shows how you do this.

How to use your own SSL certificate
In this how-to guide you will learn how to make sure your system accepts the PRTG SSL certificate when you try to open the PRTG web interface.
Storage Monitoring
Where should I store my data? Which storage systems are reliable and provide a high level of security? In this how-to guide you learn about efficient storage monitoring with PRTG.

Monitor backups
Regular backups are crucial for companies ♦ In this how-to guide, we want to show you which sensors monitor your backups and how you get alerted in case of failures.
PRTG migration
Simply take PRTG with you when you change servers! ✦ Step-by-step instructions for migrating your PRTG installation. ➤ Read our how-to guide now!

How to monitor availability of IT services
Availability of business and IT services is crucial in today’s enterprises ➤ In this how-to guide you learn how to monitor availability as an MSP.

PRTG for MSPs: Manage access rights in 4 easy steps
As a Managed Service Provider (MSP) you can manage several customers in one PRTG installation. ➤ In this how-to guide you learn how to define user access rights.
How to manually set up your device tree in 3 easy steps
Want to monitor all your devices, but you want to build up your own device tree in PRTG instead of using the auto-discovery? Then follow this how-to guide.
How to set up bandwidth monitoring in 4 easy steps
PRTG enables bandwidth monitoring with SNMP, xFlow and additional protocols. ➤ Read our how-to guide on bandwidth monitoring here!
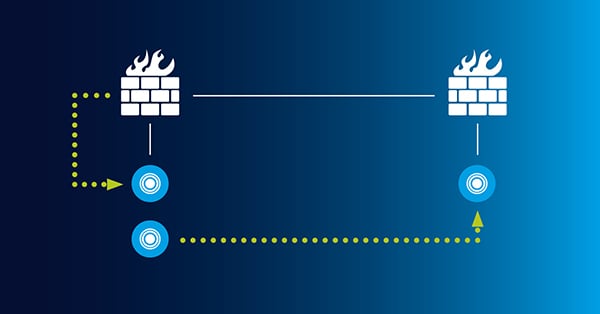
How to set up dependencies: A scenario
This how-to guide provides you with a typical business scenario for how to set up dependencies in PRTG. ➤ A VPN connection between 2 firewalls.
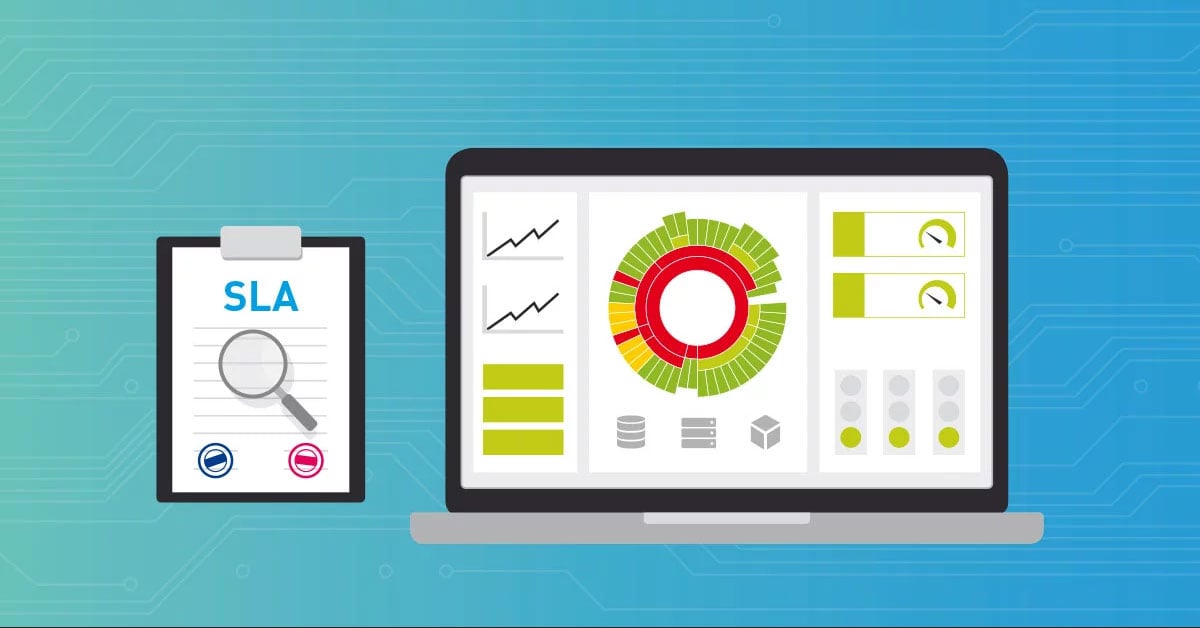
SLA Monitoring with CorpIT’s PRTG Plugin
If you need to provide numbers to support your SLAs: ➤ Our Swiss partner CorpIT created a plugin for SLA reporting. ➤ This how-to guide gets you started.

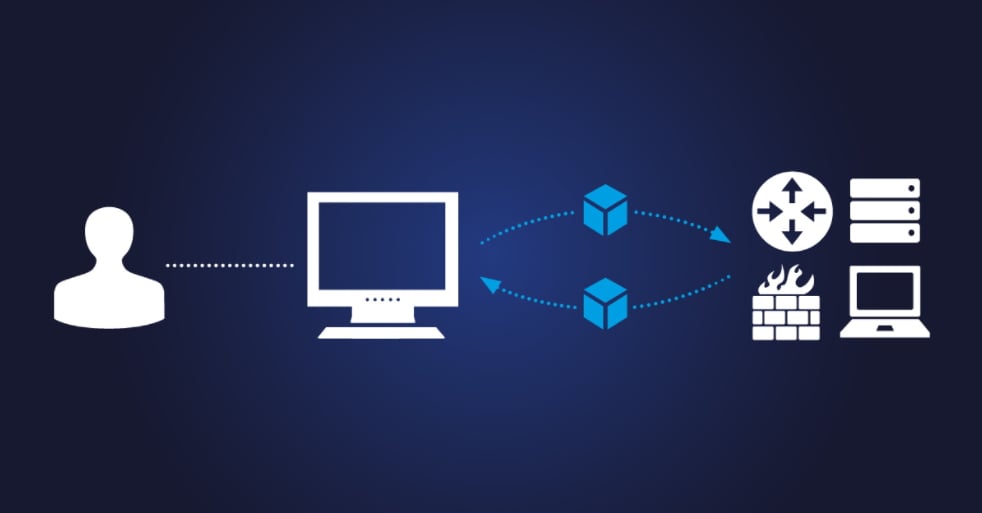
How to connect PRTG through a firewall in 4 steps
You can also access your PRTG Core Server externally! ✦ Learn how to configure the connection via the firewall. ➤ Read our how-to guide now!

How to set up scanning intervals of sensors in 3 steps
Scanning intervals for PRTG sensors are a helpful feature not to get flooded with notifications ➤ This how-to guide explains how to set them up.

How to set up reports in PRTG in 5 easy steps
Your PRTG is up and running ♦ Now the CIO wants regular reports ➤ This how-to guide shows how you set up useful and easy-to-read reports in PRTG.

How to set up notifications for PRTG MultiBoard
You already use PRTG MultiBoard ? ➤ This how-to guide shows what notifications in PRTG MultiBoard are and how you set them up fast and effectively.

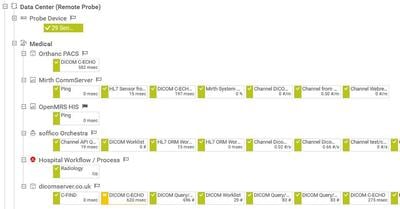
How to install a remote probe for PRTG in 4 steps
Remote probes allow you to monitor different sub-networks and to keep an eye on remote locations ➤ In this how-to you get a quick installation guide.

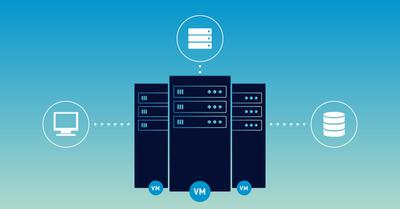
How to monitor your VMware vSphere environment
PRTG enables the monitoring of virtual environments. ✦ Monitor VMware environments! ➤ Read our how-to guide on VMware monitoring now!
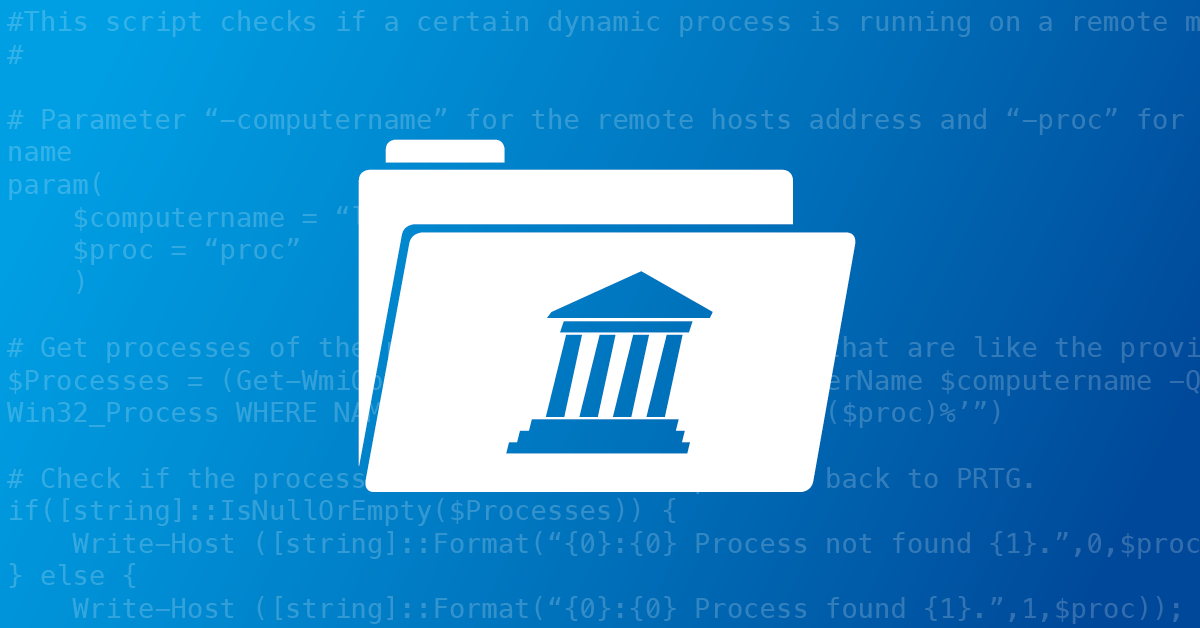
Libraries in PRTG
Libraries are a powerful PRTG feature that enables you to create individual views of your device tree. ➤ This how-to guide explains the feature step by step.
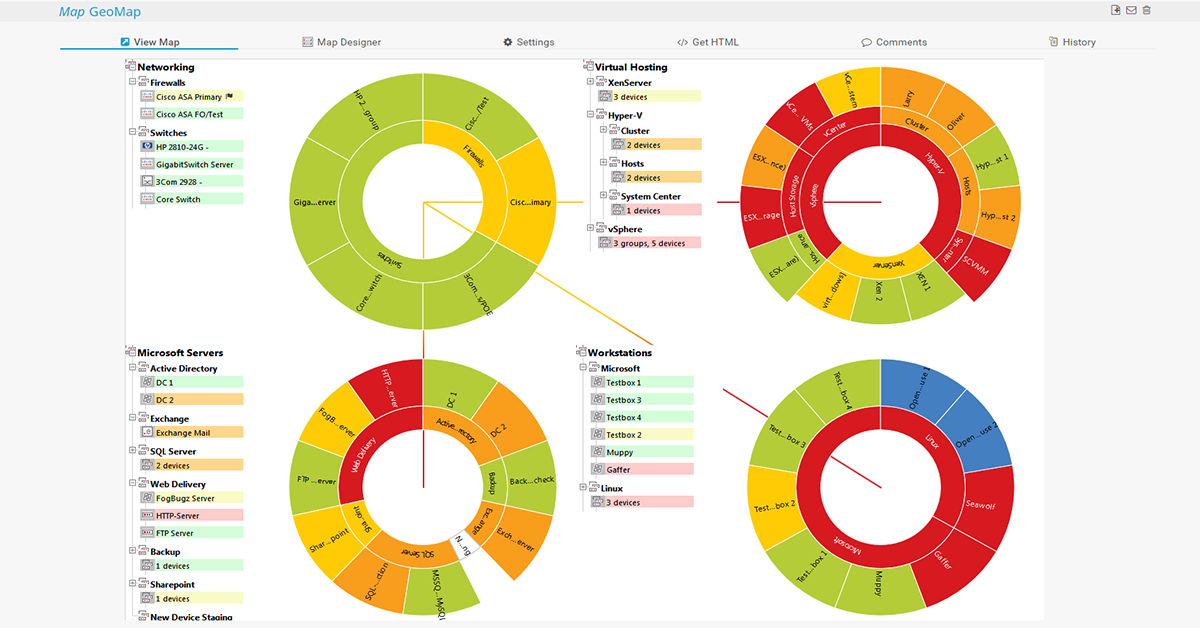
PRTG Map Designer
Do you wish to have an overview of your most important IT components in PRTG? ➤ Learn how to use dashboards with the PRTG Map Designer.
How to monitor with Flow in 3 steps
“Flow” measures the flow of data between two devices, applications, or sequence of data packets between two endpoints ➤ This how-to guide shows how to do it with PRTG

How to find the right support resource for PRTG
You have a problem with PRTG and do not know what to do? ➤ This how-to guide provides 7 support resources to choose from.
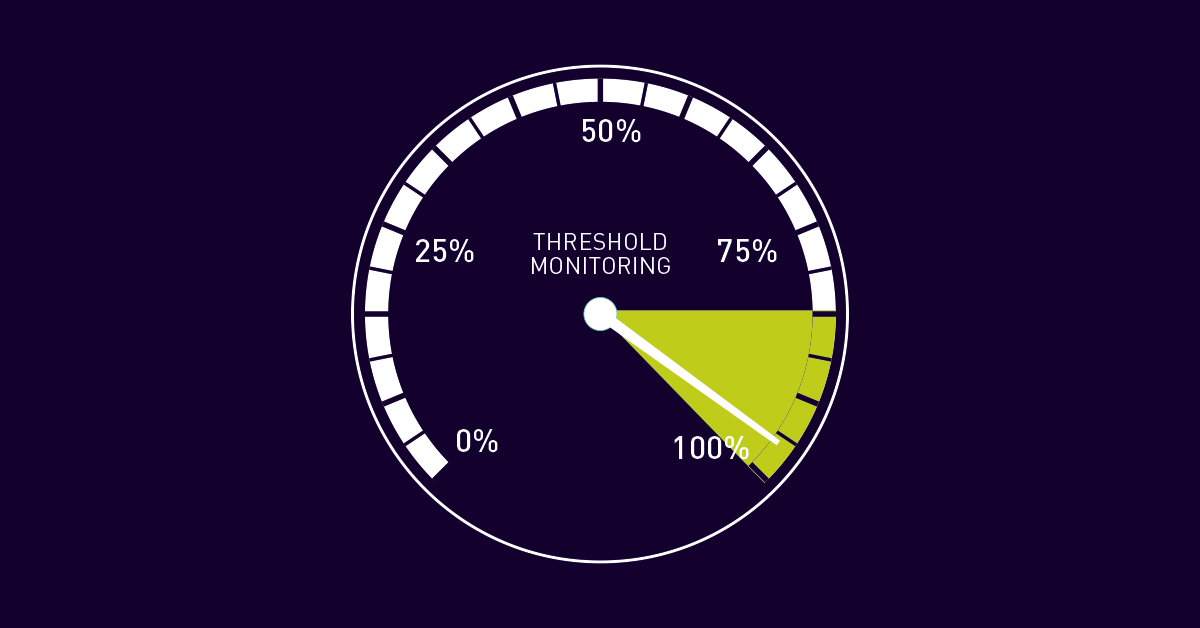
How to set up limits in PRTG in 4 steps
With the help of sensor limits in PRTG, you are immediately informed when something goes wrong within your network. ➤ This how-to guide shows you how to set up limits.
Notifications via the PRTG web interface
PRTG monitors your network 24/7/365. In this how-to guide, you will learn how to set up notifications with the PRTG web interface so that you are notified by PRTG only when it is really important.

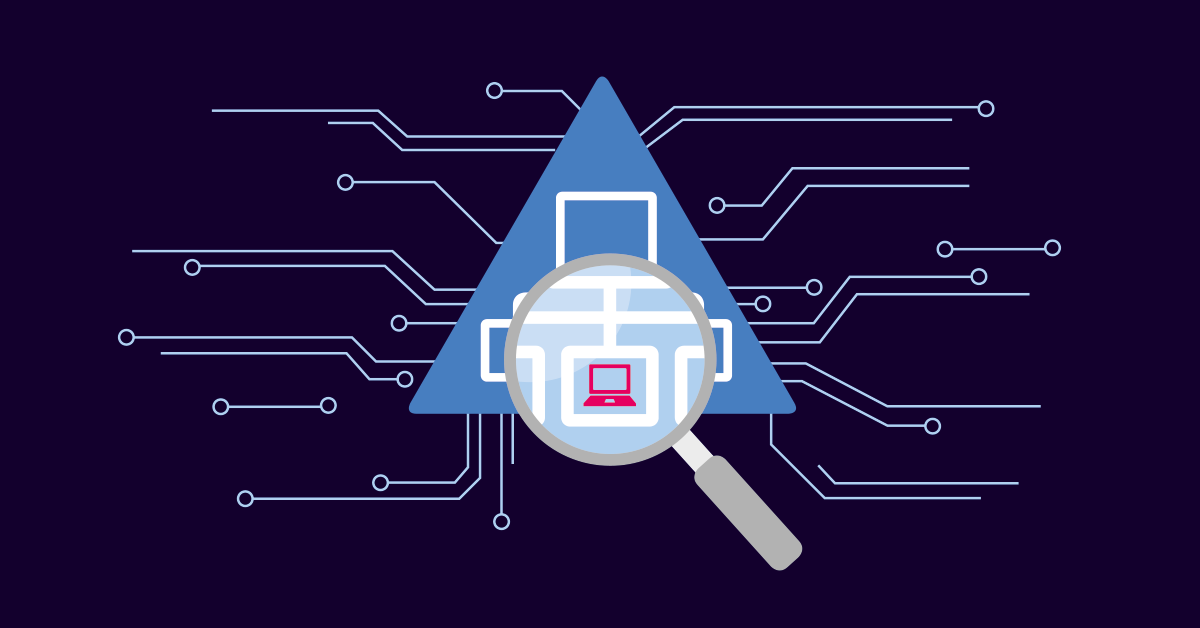
PRTG auto-discovery in 5 steps
The PRTG auto-discovery automatically finds your network devices. ➤ In this how-to guide, you will learn how the auto-discovery makes your monitoring easier.
How to integrate Active Directory in 4 steps
Active Directory (AD) facilitates user authentication in complex network environments. ➤ Read our how-to guide on Active Directory here!
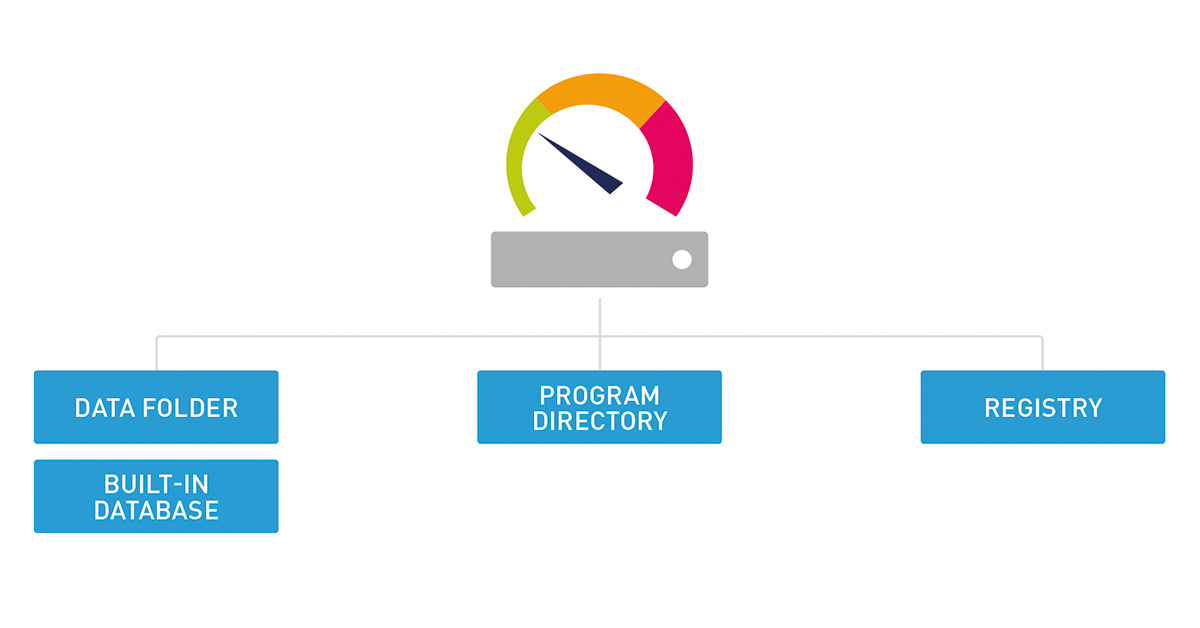
How to find your stored data for PRTG
You are starting PRTG for the first time and wonder: How does PRTG store its huge amount of data? ➤ This how-to guide is the answer.

How to set up web server monitoring in 3 steps
Web servers are a critical part of every business. ➤ This how-to guide shows what you should monitor, and what are the most important components and services.
We'll make you a monitoring expert
Gain practical knowledge on how to monitor your infrastructure with Paessler PRTG. Our training sessions are planned and provided by Paessler system engineers and are suitable for different experience levels.