![]()
Server monitoring via
Secure Shell
PRTG makes server monitoring via Secure Shell both secure and efficient

Use SSH monitoring to keep an eye on Unix-based systems
Test dedicated Linux or macOS servers for availability and peformance
Enjoy secure SSH monitoring thanks to an encrypted connection
SSH Monitoring: PRTG keeps you in the know
![]() SNMP stands for Simple Network Management Protocol. Its usefulness in network administration comes from the fact that it allows information to be collected about network-connected devices in a standardized way across a large variety of hardware and software types. SNMP is a protocol for management information transfer in networks, for use in LANs especially, depending on the chosen version.
SNMP stands for Simple Network Management Protocol. Its usefulness in network administration comes from the fact that it allows information to be collected about network-connected devices in a standardized way across a large variety of hardware and software types. SNMP is a protocol for management information transfer in networks, for use in LANs especially, depending on the chosen version.
Read more
![]()
Complex network infrastructures
Most corporate network infrastructures are not just limited to one single operating system or type of computer or server. Various versions of Windows Server and Client are used for many applications, as are Linux systems – even for IT infrastructures that are based mainly on Windows. The number of available web and file servers is astonishing. And most companies have at least one department that uses macOS.
![]()
Maintain an overview
As an administrator, it’s your job to keep an eye on what is going on in the company network. But with countless different tools to check in the event of a problem, things can get out of hand quickly. This is where PRTG comes in. With our professional monitoring solution, you will not only be securing the operation of Windows systems, but can also take advantage of a variety of monitoring protocols to monitor Linux distributions and macOS systems. Along with the Simple Network Management Protocol (SNMP), Secure Shell (SSH) is an especially good choice for such monitoring.
![]()
Prevent downtime
PRTG uses SSH monitoring to collect performance data and system information from computers and servers that can be accessed via Secure Shell. As a result, PRTG lets you check the availability, response times, and other system data of your Unix-based systems. This information can then be used to quickly fix network malfunctions and protocol errors and increase the availability of applications and services on Linux and macOS systems. SSH is also a good choice for monitoring SAN (storage area network) systems. And to do so, you won’t need to install any additional software on your target systems.
![]()
Security is guaranteed
The SSH protocol transmits monitoring data over an encrypted connection, thereby ensuring your systems always remain secure. The SSH authentication can be done with a password or OpenSSH-RSA private key - with PRTG, both are possible.
PRTG lets everyone work with the utmost security.
How SSH monitoring with PRTG works
![]() How PRTG defines sensors
How PRTG defines sensors
In PRTG, “sensors” are the basic monitoring elements. One sensor usually monitors one measured value in your network, e.g. the traffic of a switch port, the CPU load of a server, the free space of a disk drive. On average you need about 5-10 sensors per device or one sensor per switch port.
![]()
Collecting data with SSH
By using Secure Shell (SSH) for your monitoring, you can gather the system information and performance data of servers connected to Linux and Unix distributions, macOS computers, and SANs. PRTG automatically connects to the target server and establishes the SSH connection between the two computers. You therefore won’t have to install any additional software on the target system.
![]()
Authentication
To monitor via SSH, PRTG requires login information for the target system, ideally with root access. PRTG allows for authentication using a password or an OpenSSH-RSA private key. Simply enter your login details into PRTG in the device settings. With PRTG, you can also use these details to access more than just individual devices, and have the information transmitted automatically so it does not have to be re-entered each time a new device is added. Find out more about authentication in our knowledge base.
![]()
Several SSH sensors at your disposal
If you used an IP address or DNS name to add your end device to PRTG, then you have the choice of several native SSH sensors for ensuring the smooth functioning of your network. PRTG comes with default sensors for monitoring average loads, available inodes, and hard drive capacity. You can also monitor the ability of a Linux or macOS computer to connect to another device, or query FTP servers by way of SFTP (FTP over SSH). Your SSH monitoring is made complete by the built-in SAN sensors of PRTG, which let you keep a constant eye on the logical and physical disks, system status, and storage information of your SANs!
![]() An IP address (internet protocol address) is a numerical representation that uniquely identifies a specific interface on the network. IP addresses are binary numbers but are typically expressed in decimal form (IPv4) or hexadecimal form (IPv6) to make reading and using them easier for humans.
An IP address (internet protocol address) is a numerical representation that uniquely identifies a specific interface on the network. IP addresses are binary numbers but are typically expressed in decimal form (IPv4) or hexadecimal form (IPv6) to make reading and using them easier for humans.
Read more
![]()
Create your own sensors
With PRTG, if you’re unable to find the required sensors for your SSH monitoring, you can simply write your own. To do so, create a script that returns a numerical value, XML, or JSON from the target device, and monitor the result with an SSH Script sensor. PRTG can be customized to meet all your needs.
See the PRTG user manual for a list of all available SSH sensors
An introduction to SSH monitoring with PRTG

PRTG Sunburst
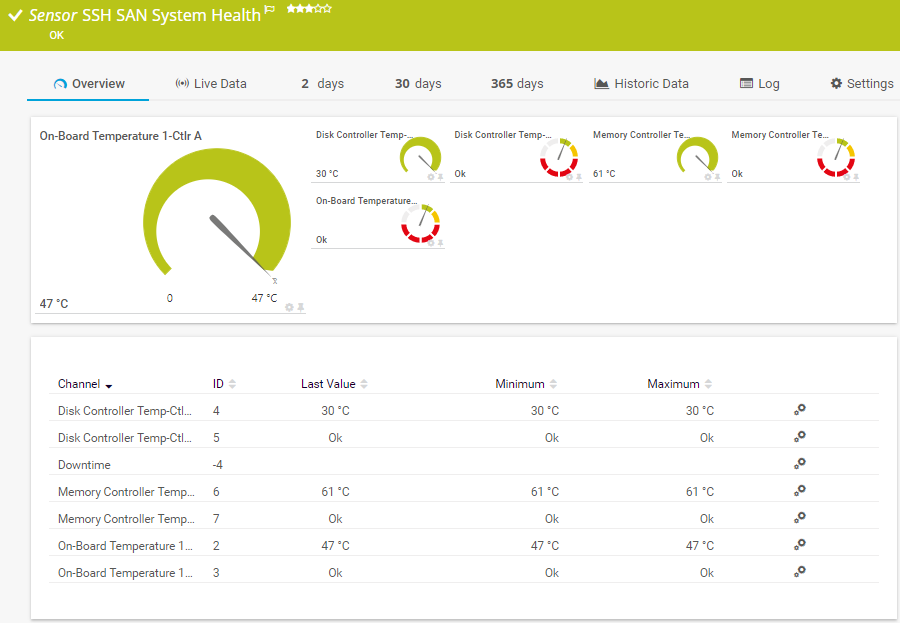
SSH SAN System Health Sensor
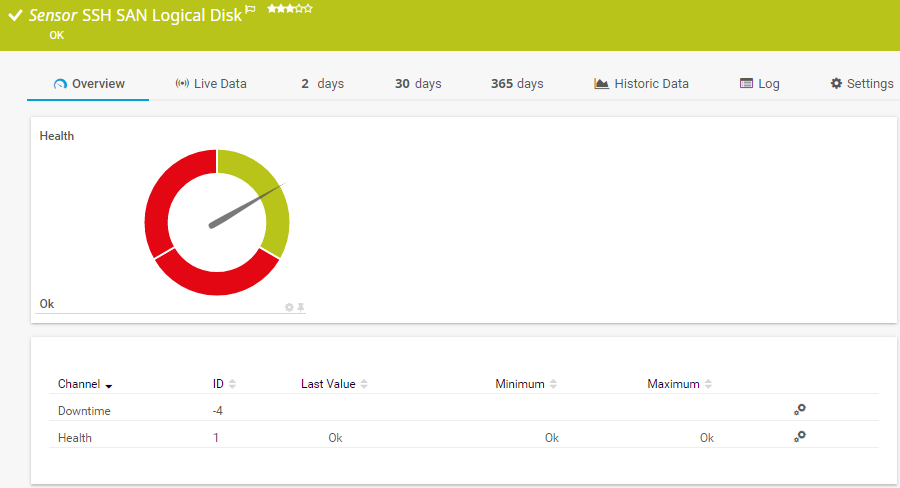
SSH SAN Logical Disk Sensor
Immediately see if your server is available – even while on the go
Set up PRTG in minutes and use it on almost any mobile device.


PRTG makes your job easier
Our monitoring software frees you to focus on other tasks by promptly notifying you of potential issues.
![]()
Save effort
PRTG gives you one central monitoring tool for your servers and entire network. Enjoy a quick overview of your whole infrastructure via our dashboard and app.
![]()
Save time
Getting started with PRTG is a breeze. Setting up or switching from another network monitoring tool is easy thanks to the auto-discovery and pre-configured device templates.
![]()
Save money
80% of our customers report substantial cost savings with network monitoring. Your costs of licenses will likely pay for themselves within weeks.
![]()
“We can all work with greater peace of mind knowing
that our systems are constantly being monitored.”
Markus Puke, Network Administrator, Schüchtermann Klinik, Germany
SSH data gathered by PRTG
![]() Ping is a command-line utility, available on virtually any operating system with network connectivity, that acts as a test to see if a networked device is reachable. The ping command sends a request over the network to a specific device. A successful ping results in a response from the computer that was pinged back to the originating computer.
Ping is a command-line utility, available on virtually any operating system with network connectivity, that acts as a test to see if a networked device is reachable. The ping command sends a request over the network to a specific device. A successful ping results in a response from the computer that was pinged back to the originating computer.
Read more
- Server availability and response times
- Average server load
- Available memory (Meminfo)
- Available disk space
- Number of available inodes
- Connectivity to other devices via remote Ping
- Custom values via user-defined scripts
- Response time of an FTP server in a Linux/Unix environment (SFTP)
PRTG also uses SSH to gather the following data from an SAN:
- Status of an SAN enclosure, including the statuses of power supplies and controllers
- Status of logical and physical disks, including I/O operations and the amount of data transferred per second
- System status of an SAN, including temperature and power supply data
Trusted by 500,000 users and recognized
by industry analysts as a leader
by industry analysts as a leader

“Fantastic network and infrastructure monitoring solution that is easy to deploy and easier still to use. Simply the best available.”

“Software is absolutely perfect, Support is superior. Meets all needs and requirements, this is a must have solution if you are needing any form of monitoring.”

“The tool excels at its primary focus of being a unified infrastructure management and network monitoring service.”
4 good reasons to choose PRTG as your SSH monitoring tool
![]()
Increased availability
Servers, services, and applications suffer fewer disruptions and react faster, which in turn boosts their availability.
![]()
Quick troubleshooting
Network failures and protocol errors are detected promptly and can therefore be remedied at once – not just on Windows operating systems, but also Linux-based ones!
![]()
Secure data traffic
With SSH monitoring, you can be sure the connections required for your monitoring are secure thanks to SSH authentication and encryption. As a result, you will minimize security risks.
![]()
Comprehensive overview
The convenient PRTG dashboard provides an overview of the status, functionality, and performance of your entire server infrastructure.
We asked: would you recommend PRTG?
Over 95% of our customers say yes!
Paessler AG conducted trials in over 600 IT departments worldwide to tune its network monitoring software closer to the needs of sysadmins.
The result of the survey: over 95% of the participants would recommend PRTG – or already have.

Create innovative solutions with Paessler’s partners
Partnering with innovative vendors, Paessler unleashes synergies to create
new and additional benefits for joined customers.


UVnetworks
UVexplorer integrates tightly with PRTG to bring fast and accurate network discovery, detailed device inventory, and automatic network mapping to the PRTG platform.

Also interesting:
PRTG offers integrated complete Active Directory Monitoring in real time. Find out more about Active Directory Monitoring here.
Network Management: PRTG monitors all your network activities, hardware like routers, your file servers and websites in real time. Even remote networks can be monitored easily by PRTG.
SSL Monitoring: PRTG determines the extent to which your connections are protected. You can therefore learn if your connections are strong, weak, or not protected at all.
“Easy to implement and configure with good technical support.”
R. v. S., ICT Manager at Heinen & Hopman Eng BV

PRTG: The multi-tool for sysadmins
Adapt PRTG individually and dynamically to your needs and rely on a strong API:- HTTP API: Access monitoring data and manipulate monitoring objects via HTTP requests
- Custom sensors: Create your own PRTG sensors for customized monitoring
- Custom notifications: Create your own notifications and send action triggers to external systems
- REST Custom sensor: Monitor almost everything that provides data in XML or JSON format
Still not convinced?
![]()
More than 500,000 sysadmins love PRTG
Paessler PRTG is used by companies of all sizes. Sysadmins love PRTG because it makes their job a whole lot easier.
Still not convinced?
![]()
Monitor your entire IT infrastructure
Bandwidth, servers, virtual environments, websites, VoIP services – PRTG keeps an eye on your entire network.
![]()
Try Paessler PRTG for free
Everyone has different monitoring needs. That’s why we let you try PRTG for free. Start now with your trial.
|
PRTG |
Network Monitoring Software - Version 24.2.94.1400 (April 10th, 2024) |
|
Hosting |
Download for Windows and cloud-based version PRTG Hosted Monitor available |
Languages |
English, German, Spanish, French, Portuguese, Dutch, Russian, Japanese, and Simplified Chinese |
Pricing |
Up to 100 sensors for free (Price List) |
Unified Monitoring |
Network devices, bandwidth, servers, applications, virtual environments, remote systems, IoT, and more |
Supported Vendors & Applications |
|