![]()
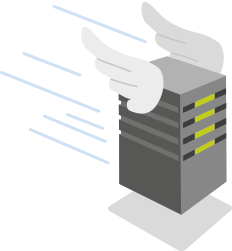
100% server uptime?
It’s possible with PRTG

Monitor the availability
of all your servers
Be promptly notified in
the event of downtime
Create custom reports
and detailed statistics
24/7 server uptime is a must!
Servers are the core elements of any IT infrastructure. It is vital that they always be accessible, both to ensure the smooth running of internal processes and the availability of your services. Server uptime, or the amount of time your servers are available to users, is one of the most important factors for optimizing network performance.
When it comes to server availability, think in terms of the “five nines.” PRTG will help you achieve the goal of 99.999% uptime.
Monitor server uptime with PRTG
The PRTG Server Uptime Monitor checks and monitors
the availability of your individual servers and devices.
If a system goes down, you'll immediately be informed
by email, SMS, or push notification. As a result,
you can quickly go about troubleshooting or
make a necessary upgrade to your hardware.
Trusted by 500,000 users and recognized
by industry analysts as a leader
by industry analysts as a leader

“Fantastic network and infrastructure monitoring solution that is easy to deploy and easier still to use. Simply the best available.”

“Software is absolutely perfect, Support is superior. Meets all needs and requirements, this is a must have solution if you are needing any form of monitoring.”

“The tool excels at its primary focus of being a unified infrastructure management and network monitoring service.”
Preconfigured sensors make PRTG monitoring easy
With PRTG, you can monitor the uptime of both physical and virtual servers. Mail servers, web servers, database servers, file servers...as long as the device can be pinged, you can monitor its uptime with PRTG.
PRTG comes with preconfigured sensors for a variety of different servers. A few clicks are all it takes to get an overview of your entire server landscape. You can also create your own sensors, and thanks to the PRTG API, tailor them to your servers.
Sensors for measuring server uptime
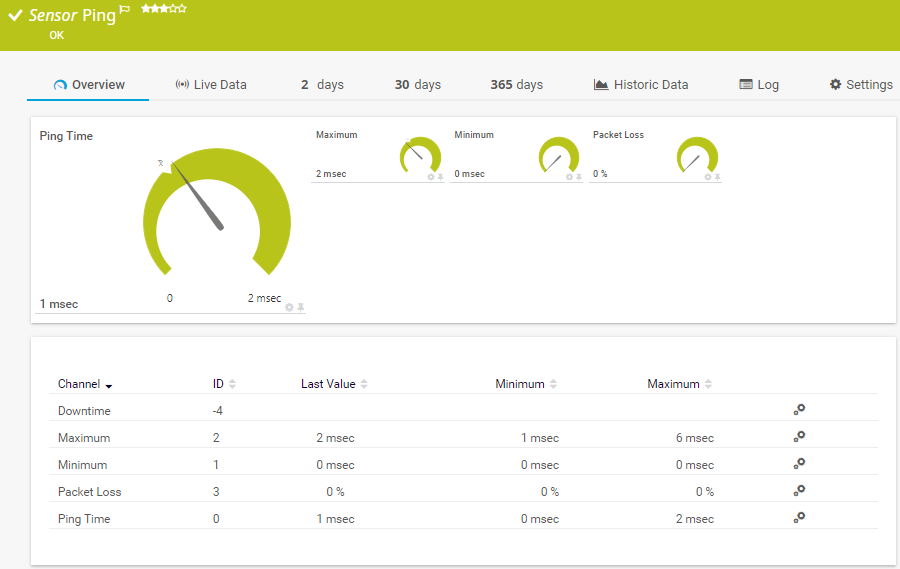
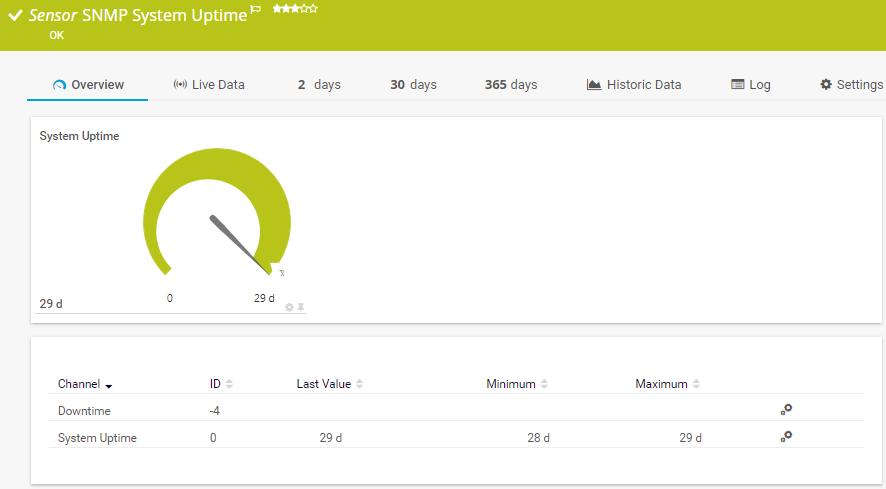
SNMP Uptime v2 Sensor:
Use this sensor to monitor the availability of SNMP-compatible servers and devices. The advantage of SNMP is that it puts little strain on your CPU and bandwidth.
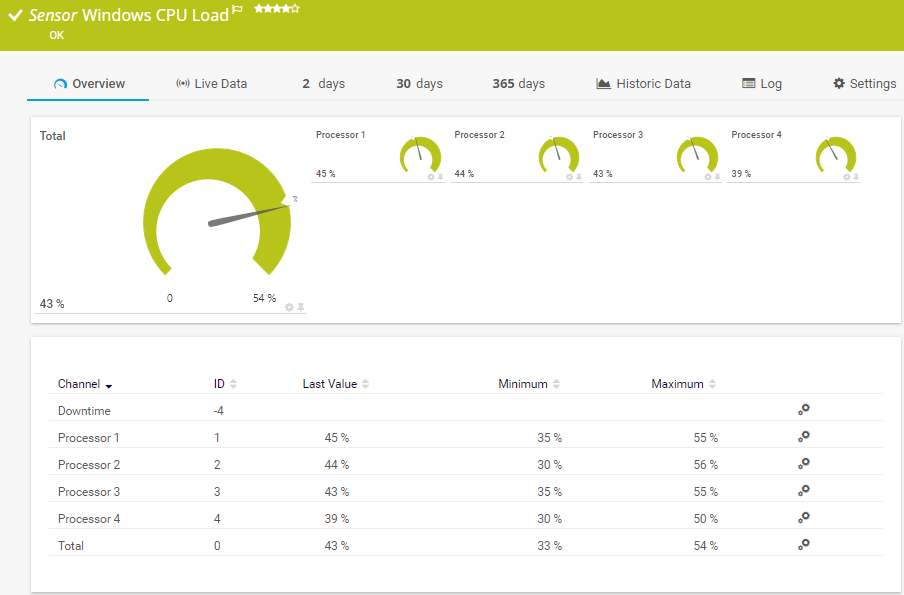
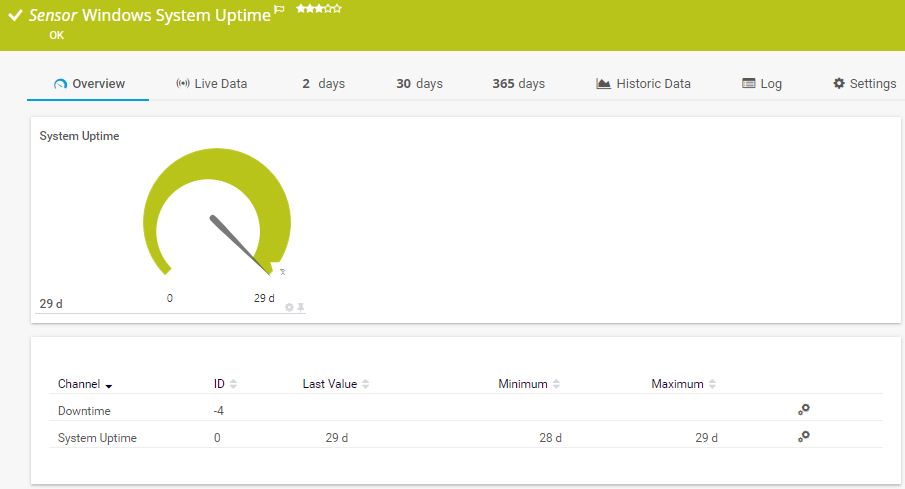
Windows System Uptime Sensor:
This sensor is specially designed to monitor Microsoft Windows servers via Windows performance counters or WMI.
Click here for an overview of 250+ sensors used
for comprehensive network monitoring.
Detailed statistics and automated reports
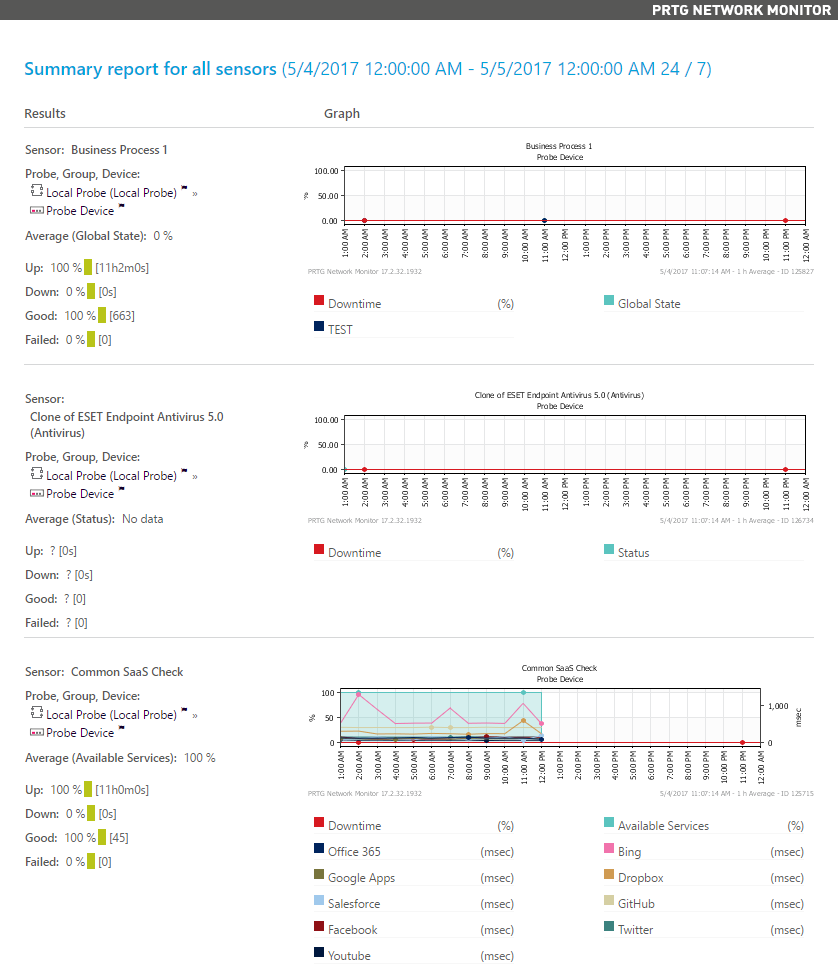
PRTG creates detailed reports on the uptime of your servers. These reports include statistics such as the amount of time your servers are down for a given period of time.
With just a few clicks, you'll generate fully automated reports that can regularly be sent to your higher-ups, for example. Detailed PRTG statistics are also useful for demonstrating to service providers that they have not fulfilled the terms of a service-level agreement.
Create innovative solutions with Paessler’s partners
Partnering with innovative vendors, Paessler unleashes synergies to create
new and additional benefits for joined customers.


With ScriptRunner, Paessler integrates a powerful event automation platform into PRTG Network Monitor.
ScriptRunner
PRTG in a nutshell
PRTG monitors your entire IT infrastructure
Use PRTG to monitor, for example, network traffic, applications, bandwidth, cloud services, databases, virtual environments, availability & uptime, ports, IP addresses, hardware status, network security, web services, and much more.
PRTG supports the most important technologies
Monitor your network for example via SNMP, flow protocols (NetFlow, jFlow, sFlow, IPFIX), SSH, WMI, or ping. PRTG also supports technologies used in Industrial IT & OT environments, such as OPC UA, MQTT, or Modbus. Use the powerful PRTG API for custom integrations (for example via Python, PowerShell, or REST).
PRTG can be used for any operating system
Download and install PRTG Network Monitor on a Windows system or use our cloud-based product PRTG Hosted Monitor for all other operating systems. What’s more: our native PRTG Desktop application runs on Windows or macOS – for even quicker access & multi-server views.
Still not convinced?
![]()
More than 500,000 sysadmins love PRTG
Paessler PRTG is used by companies of all sizes. Sysadmins love PRTG because it makes their job a whole lot easier.
Still not convinced?
![]()
Monitor your entire IT infrastructure
Bandwidth, servers, virtual environments, websites, VoIP services – PRTG keeps an eye on your entire network.
![]()
Try Paessler PRTG for free
Everyone has different monitoring needs. That’s why we let you try PRTG for free. Start now with your trial.
|
PRTG |
Network Monitoring Software - Version 24.2.94.1400 (April 10th, 2024) |
|
Hosting |
Download for Windows and cloud-based version PRTG Hosted Monitor available |
Languages |
English, German, Spanish, French, Portuguese, Dutch, Russian, Japanese, and Simplified Chinese |
Pricing |
Up to 100 sensors for free (Price List) |
Unified Monitoring |
Network devices, bandwidth, servers, applications, virtual environments, remote systems, IoT, and more |
Supported Vendors & Applications |
|