![]()
Monitor memory with PRTG & never run out of RAM again, with PRTG
- Continuously monitor and analyze RAM usage across your network
- Get alerted promptly in case of issues
- Compatible with Windows, Linux, and Unix systems
Our users give top ratings for monitoring with Paessler PRTG


PRTG memory monitoring: What you’ll find on this page

PRTG makes monitoring memory easy
Custom alerts and data visualizations make it easy to monitor, identify, and prevent low RAM and allocate more resources before it’s too late.
Every network component needs RAM
But when servers, applications, or other devices use too much of it… Well, that's where the problems start. Poor server performance. Applications that take ages to load. Frozen screens. You get the idea.
The good news is that optimizing memory is usually relatively straightforward. But only if you can pinpoint the cause of the problem. Which is where Paessler PRTG comes in.
With a highly configurable user interface, round-the-clock monitoring, and automatic, customizable alerts, PRTG keeps a close watch on RAM usage across your network. That way, when memory is running low, you'll know exactly what you need to do to free up more.
Don't forget your memory: 3 reasons why to choose PRTG as your memory monitoring tool
Set it and forget it
Pick your warning and error thresholds and let PRTG do the work. Sophisticated sensors monitor your network 24/7 and alert you when memory-hungry components or other issues risk draining your RAM, so you can step in before your network slows to a standstill.
Proactively fix issues
Addressing drains, bottlenecks, and other causes of low RAM is good. But preventing them is much, much better. PRTG lets you know even before issues happen and notifies you via email, SMS, push notification, and more. Which means you'll never get caught on the back foot again.
More than RAM monitoring
PRTG can keep an eye on your whole network infrastructure: applications, bandwidth, databases, websites, servers… the list goes on. Our highly customizable, all-in-one network monitoring tool gives you the peace of mind that nothing will fall through the cracks.
What memory monitoring looks like in PRTG
Diagnose network issues by continuously monitoring the available, used, and total memory of different network components. Show RAM usage in real time and visualize data in graphic maps & dashboards to identify problems more easily. Gain the visibility you need to troubleshoot bottlenecks, underperformance, and other memory-related issues.

Device tree view of the complete monitoring setup
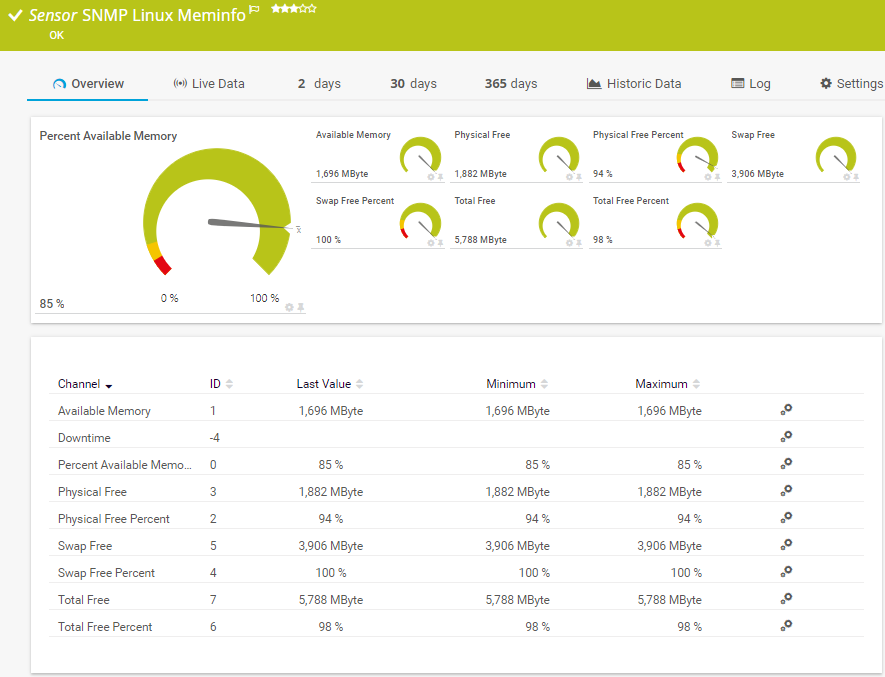
SNMP Linux Meminfo sensor in PRTG

Custom PRTG dashboard for keeping an eye on the entire IT infrastructure
Start monitoring RAM with PRTG and see how it can make your network more reliable and your job easier.
“All-around winning “The real beauty of PRTG is the endless possibilities it offers” “Outstanding cloud IT experts agree: Paessler PRTG is a great solution for IT infrastructure monitoring

network monitor”

monitoring”
6 PRTG sensors for monitoring & analyzing memory
With its preconfigured sensors that come with PRTG out-of-the-box, our memory monitoring software helps you maintain optimal RAM. All sensors keep an eagle eye on the parameters that could impact memory availability across your network.
SNMP Memory
The SNMP Memory sensor lets you view any system's available memory (in bytes and percent) and total memory, using the Simple Network Management Protocol (SNMP).
WMI Memory
The WMI Memory sensor tracks free memory (in bytes and percent) on Windows systems, using Windows Management Instrumentation (WMI).
SSH Meminfo
The SSH Meminfo sensor monitors available memory (in bytes and percent) on Linux and other Unix-based systems, using Secure Shell (SSH).
SNMP HPE ProLiant Memory Controller
The SNMP HPE ProLiant Memory Controller sensor monitors the status and condition of a memory controller and available modules in an HPE server, using SNMP.
SNMP IBM System X Physical Memory
The SNMP IBM System X Physical Disk sensor monitors the condition and power status of IBM server memory modules, using SNMP.
SNMP Linux Meminfo
The SNMP Linux Meminfo sensor tracks memory use on Linux and Unix systems, using SNMP. It shows available memory, free physical and swap memory, and free total memory (all in bytes and percent).
![]()
Need to monitor other components or parameters?
With more than 250 preconfigured sensors to choose from, we can all but guarantee you'll find one that can do it. But, if you don't, you can easily create your own custom sensors.
Your memory monitor at a glance – even on the go
Set up PRTG in minutes and use it on almost any mobile device.


Easily find the source of the problem with our PRTG memory monitoring solution
Real-time alerts and custom notifications make it easy to solve issues such as performance bottlenecks, memory-hungry network components, and other causes of low RAM.
PRTG is compatible with all major vendors, products, and systems
![]()
Create innovative solutions with Paessler’s partners
Partnering with innovative vendors, Paessler unleashes synergies to create
new and additional benefits for joined customers.

With the combination of PRTG and Insys, the monitoring specialist Paessler and the industrial gateway manufacturer INSYS icom offer a practical possibility to merge IT and OT.
INSYS icom

“Excellent tool for detailed monitoring. Alarms and notifications work greatly. Equipment addition is straight forward and server initial setup is very easy. ...feel safe to purchase it if you intend to monitor a large networking landscape.”
Infrastructure and Operations Engineer in the Communications Industry, firm size 10B - 30B USD
PRTG makes monitoring memory easy
Custom alerts and data visualizations make it easy to monitor, identify, and prevent low RAM and allocate more resources before it’s too late.
Monitor memory: FAQ
What is RAM?
RAM stands for Random Access Memory. It's a type of computer memory that allows data to be stored and retrieved quickly by the computer's processor. RAM is considered volatile memory, meaning that it loses its contents when the power is turned off.
The speed and capacity of RAM can significantly affect a computer's performance. More RAM allows a computer to handle larger and more complex tasks simultaneously, while faster RAM can improve overall system responsiveness.
What is memory monitoring?
Memory monitoring refers to the process of tracking and analyzing the usage of RAM in a computer system. It involves continuously monitoring the amount of memory that is used by various processes and applications running on the system.
Memory monitoring tools like PRTG provide real-time data on memory usage and help users identify potential performance issues such as memory leaks or excessive resource consumption.
What does PRTG RAM monitoring include?
PRTG is a proprietary software tool that works as a memory checker and tracks and analyzes RAM usage across your network. Available for on-premises servers or as a cloud-hosted solution, it helps you pinpoint memory-hungry applications, servers, and other network components, so you can prevent bottlenecks and other issues and ensure there's always enough memory available to meet your organization's needs.
How does PRTG monitor memory?
PRTG uses sophisticated sensors that monitor RAM usage across your network using SNMP, WMI, or SSH. Each sensor tracks a specific parameter. Set a threshold, and PRTG will ping you via email, text, or in-app notification if a given parameter goes over or under it so you can make the necessary adjustments to optimize RAM before it slows down your network.
What is a sensor in PRTG?
In PRTG, “sensors” are the basic monitoring elements. One sensor usually monitors one measured value in your network, for example the traffic of a switch port, the CPU load of a server, or the free space on a disk drive.
On average, you need about 5-10 sensors per device or one sensor per switch port.

PRTG: The multi-tool for sysadmins
Adapt PRTG individually and dynamically to your needs and rely on a strong API:- HTTP API: Access monitoring data and manipulate monitoring objects via HTTP requests
- Custom sensors: Create your own PRTG sensors for customized monitoring
- Custom notifications: Create your own notifications and send action triggers to external systems
- REST Custom sensor: Monitor almost everything that provides data in XML or JSON format
Paessler AG conducted trials in over 600 IT departments worldwide to tune its network monitoring software closer to the needs of sysadmins. We asked: would you recommend PRTG?
Over 95% of our customers say yes!
The result of the survey: over 95% of the participants would recommend PRTG – or already have.
Paessler PRTG is used by companies of all sizes. Sysadmins love PRTG because it makes their job a whole lot easier. Bandwidth, servers, virtual environments, websites, VoIP services – PRTG keeps an eye on your entire network. Everyone has different monitoring needs. That’s why we let you try PRTG for free.Still not convinced?
![]()
More than 500,000
sysadmins love PRTG![]()
Monitor your entire IT infrastructure
![]()
Try Paessler PRTG
for free
![]()
Start monitoring RAM with PRTG and see how it can make your network more reliable and your job easier.
|
PRTG |
Network Monitoring Software - Version 24.2.94.1400 (April 10th, 2024) |
|
Hosting |
Download for Windows and cloud-based version PRTG Hosted Monitor available |
Languages |
English, German, Spanish, French, Portuguese, Dutch, Russian, Japanese, and Simplified Chinese |
Pricing |
Up to 100 sensors for free (Price List) |
Unified Monitoring |
Network devices, bandwidth, servers, applications, virtual environments, remote systems, IoT, and more |
Supported Vendors & Applications |
|