![]()
Network traffic management
with PRTG monitoring

PRTG provides sensors to keep track of your network activity
PRTG identifies devices that generate high network traffic
PRTG monitors
the bandwidth
PRTG creates reports to analyze the network traffic
What is Network traffic management?
Network traffic management uses network monitoring tools and bandwidth monitoring to ensure optimal network operation. In this way, it helps to maximize the performance and security of existing networks. It also enables the identification of network-intensive activities that can be incorporated into network planning and growth strategies. Network traffic management is used among other optimization techniques to ensure the smooth operation of an IT infrastructure.
Network traffic management with PRTG avoids these problems
![]()
Insufficient network performance
Network devices such as routers or switches that are not configured properly can quickly compromise an entire network. This usually results in slow data transmission or network resources are no longer accessible. But applications can also reduce the performance of a network.
![]()
Impairment of Internet access
Poor network performance not only affects data traffic within a network, but also the access to resources on the Internet. It often happens that especially cloud-based applications react very slow or can no longer be accessed at all.
![]()
Disruption of communication between
company locations
If problems occur in the local network of a company, in many cases linked locations are also impacted. No access to centrally stored data or databases and collaboration platforms is usually the annoying result. But also employees who work on the road or in their home office are affected.
How to manage your network traffic with PRTG in 3 Steps
![]() How PRTG defines sensors
How PRTG defines sensors
In PRTG, “sensors” are the basic monitoring elements. One sensor usually monitors one measured value in your network, e.g. the traffic of a switch port, the CPU load of a server, the free space of a disk drive. On average you need about 5-10 sensors per device or one sensor per switch port.
![]()
Step 1: Monitoring of the Network
By monitoring the network and its individual devices, you can quickly get an overview of the data traffic. PRTG is perfectly suited for this and provides you with numerous sensors such as NetFlow, sFlow or Packet Sniffer for monitoring. No matter if it is a Windows server or hardware from a well-known manufacturer.
![]()
Step 2: Create reports to gain an overview
PRTG not only monitors the entire network and traffic but also provides you with reports according to your needs. This allows you to view and analyze your network traffic over a longer period of time. This is especially helpful when there is a high volume of data traffic outside of working hours that would otherwise have gone unnoticed.
![]()
Step 3: Manage the network traffic
Now that you have obtained information from the data generated by the sensors and analyzed reports, you can make better informed decisions. For example, if increased traffic occurs at certain times, you can now define the cause and take appropriate action.
This is what network traffic management looks like
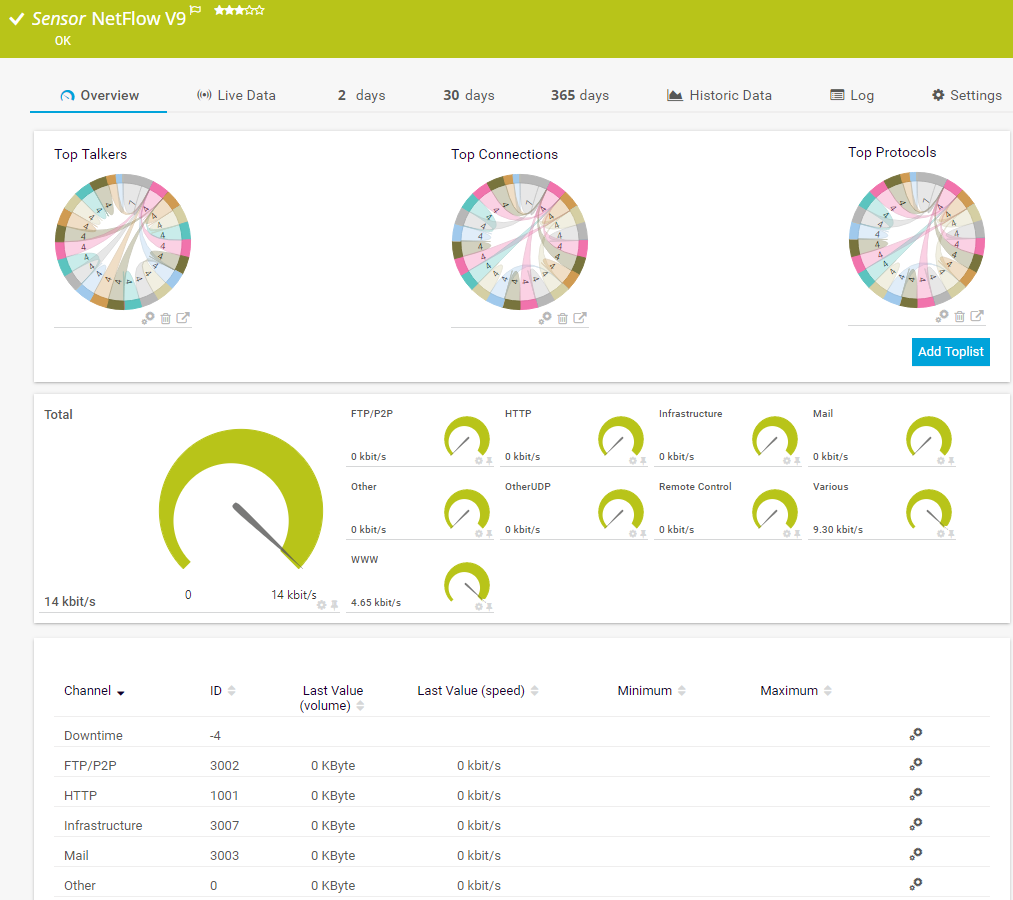
Sensor NetFlow v9
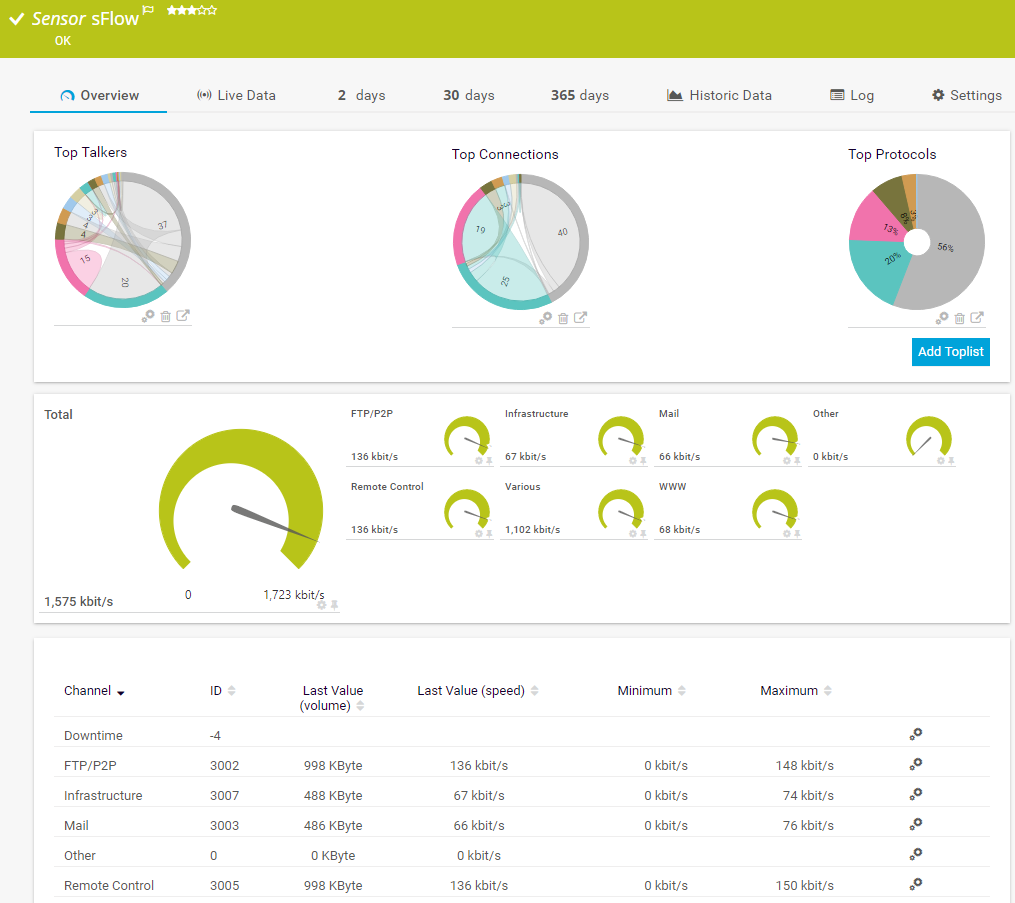
Sensor sFlow
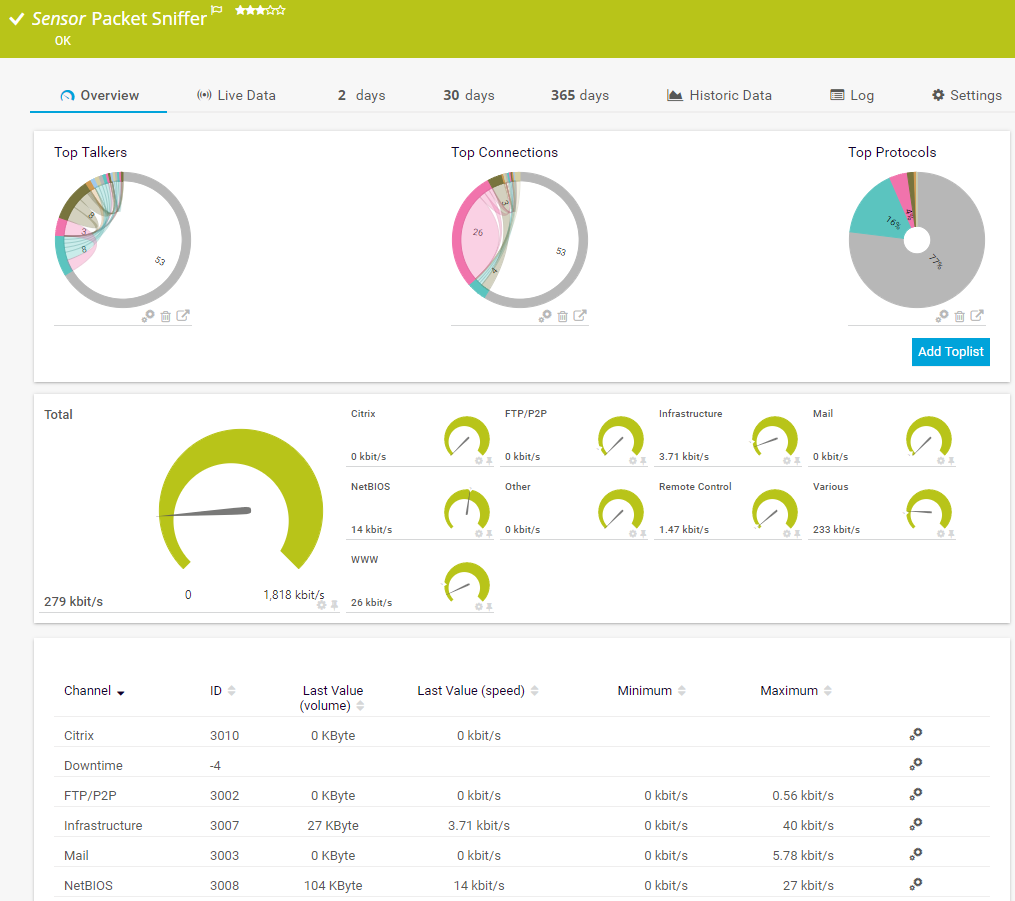
Sensor Packet Sniffer
3 sensors for network traffic management
Besides a variety of sensors that are available natively in PRTG, reports provide a good basis for making decisions to optimize traffic.
NetFlow sensor
The NetFlow v5 sensor receives traffic data from a NetFlow v5-compatible device and shows the traffic by type. Ensure that the sensor matches the NetFlow version that your device exports. Several filter options are available to divide traffic into different channels.
sFlow sensor
The sFlow sensor receives traffic data from an sFlow v5-compatible device and shows the traffic by type. Only header traffic is analyzed. Make sure that the device matches sFlow Several filter options are available to divide traffic into different channels.
Packet Sniffer sensor
The Packet Sniffer sensor monitors the headers of data packets that pass a local network card using a built-in packet sniffer. You can choose from predefined channels. The sensor analyzes only header traffic.
Reports
PRTG includes a reporting engine for on-demand report generation as well as scheduled report generation in HTML, PDF, comma-separated values (CSV), and Extensible Markup Language (XML) format. Furthermore, you can create reports for a single sensor or for a whole range of sensors.
Trusted by 500,000 users and recognized
by industry analysts as a leader

“Fantastic network and infrastructure monitoring solution that is easy to deploy and easier still to use. Simply the best available.”

“Software is absolutely perfect, Support is superior. Meets all needs and requirements, this is a must have solution if you are needing any form of monitoring.”

“The tool excels at its primary focus of being a unified infrastructure management and network monitoring service.”
PRTG can do more
![]()
Show unusual
network utilization
PRTG not only informs you about high usage of the network but can also inform you about unusually high utilization. This way you can act before it happens.
 Be informed
PRTG will warn you via email, SMS, push message, ... if a predefined or self-defined limit value is reached.
![]()
All-in-one monitoring
PRTG comes with predefined sensors for many manufacturers you can use out of the box, an alarm system and technical support. If you opt for a license, you’ll get access to its full range of monitoring features. Only the number of sensors is limited.
Create innovative solutions with Paessler’s partners
Partnering with innovative vendors, Paessler unleashes synergies to create
new and additional benefits for joined customers.


With ScriptRunner, Paessler integrates a powerful event automation platform into PRTG Network Monitor.
ScriptRunner
PRTG in a nutshell
PRTG monitors your entire IT infrastructure
Use PRTG to monitor, for example, network traffic, applications, bandwidth, cloud services, databases, virtual environments, availability & uptime, ports, IP addresses, hardware status, network security, web services, and much more.
PRTG supports the most important technologies
Monitor your network for example via SNMP, flow protocols (NetFlow, jFlow, sFlow, IPFIX), SSH, WMI, or ping. PRTG also supports technologies used in Industrial IT & OT environments, such as OPC UA, MQTT, or Modbus. Use the powerful PRTG API for custom integrations (for example via Python, PowerShell, or REST).
PRTG can be used for any operating system
Download and install PRTG Network Monitor on a Windows system or use our cloud-based product PRTG Hosted Monitor for all other operating systems. What’s more: our native PRTG Desktop application runs on Windows or macOS – for even quicker access & multi-server views.
Still not convinced?
![]()
More than 500,000 sysadmins love PRTG
Paessler PRTG is used by companies of all sizes. Sysadmins love PRTG because it makes their job a whole lot easier.
Still not convinced?
![]()
Monitor your entire IT infrastructure
Bandwidth, servers, virtual environments, websites, VoIP services – PRTG keeps an eye on your entire network.
![]()
Try Paessler PRTG for free
Everyone has different monitoring needs. That’s why we let you try PRTG for free. Start now with your trial.
|
PRTG |
Network Monitoring Software - Version 24.2.94.1400 (April 10th, 2024) |
|
Hosting |
Download for Windows and cloud-based version PRTG Hosted Monitor available |
Languages |
English, German, Spanish, French, Portuguese, Dutch, Russian, Japanese, and Simplified Chinese |
Pricing |
Up to 100 sensors for free (Price List) |
Unified Monitoring |
Network devices, bandwidth, servers, applications, virtual environments, remote systems, IoT, and more |
Supported Vendors & Applications |
|