![]()
IIS monitoring tool PRTG

PRTG monitors every aspect
of your IIS servers
PRTG secures your
web page performance
IIS Monitoring in PRTG
comes out of the box
IIS Monitoring: Why it is important
For many companies their existence depends directly on a high-performing and an always available website, which sometimes is the business model itself, sometimes it’s responsible for creating sales in the form of a shop. Often it’s the most important tool for new customer acquisition and customer care. Even if the Internet appearance doesn’t have a vital significance, no company can afford long response times or failures of its Internet presence without risking serious losses.
The solution is simple: Monitoring the Microsoft IIS (Internet Information Services for Windows Server) detects malfunctions and warns the responsible person so you can eliminate the problem in time.
Your IIS Performance at a glance – even on the Go
Set up PRTG in minutes and use it on almost any mobile device.


Out-of-the-box IIS Monitoring
PRTG Network Monitor offers monitoring of the Microsoft Internet Information Services server right out of the box. The PRTG Windows IIS Application Sensor keeps an eye on all important parameters, such as:
- Sent and received bytes per second
- Number of sent and received files per second
- Number of anonymous and known users per second
- Number of Common Gateway Interface (CGI) requests per second
- Number of GET and POST requests per second
- Number of not found errors per second

“The greatest advantage of PRTG? You get to rest easy.“
Steffen Ille, Bauhaus-University of Weimar, Germany
This is what IIS monitoring looks like in PRTG

Your entire web servers and web services at a glance
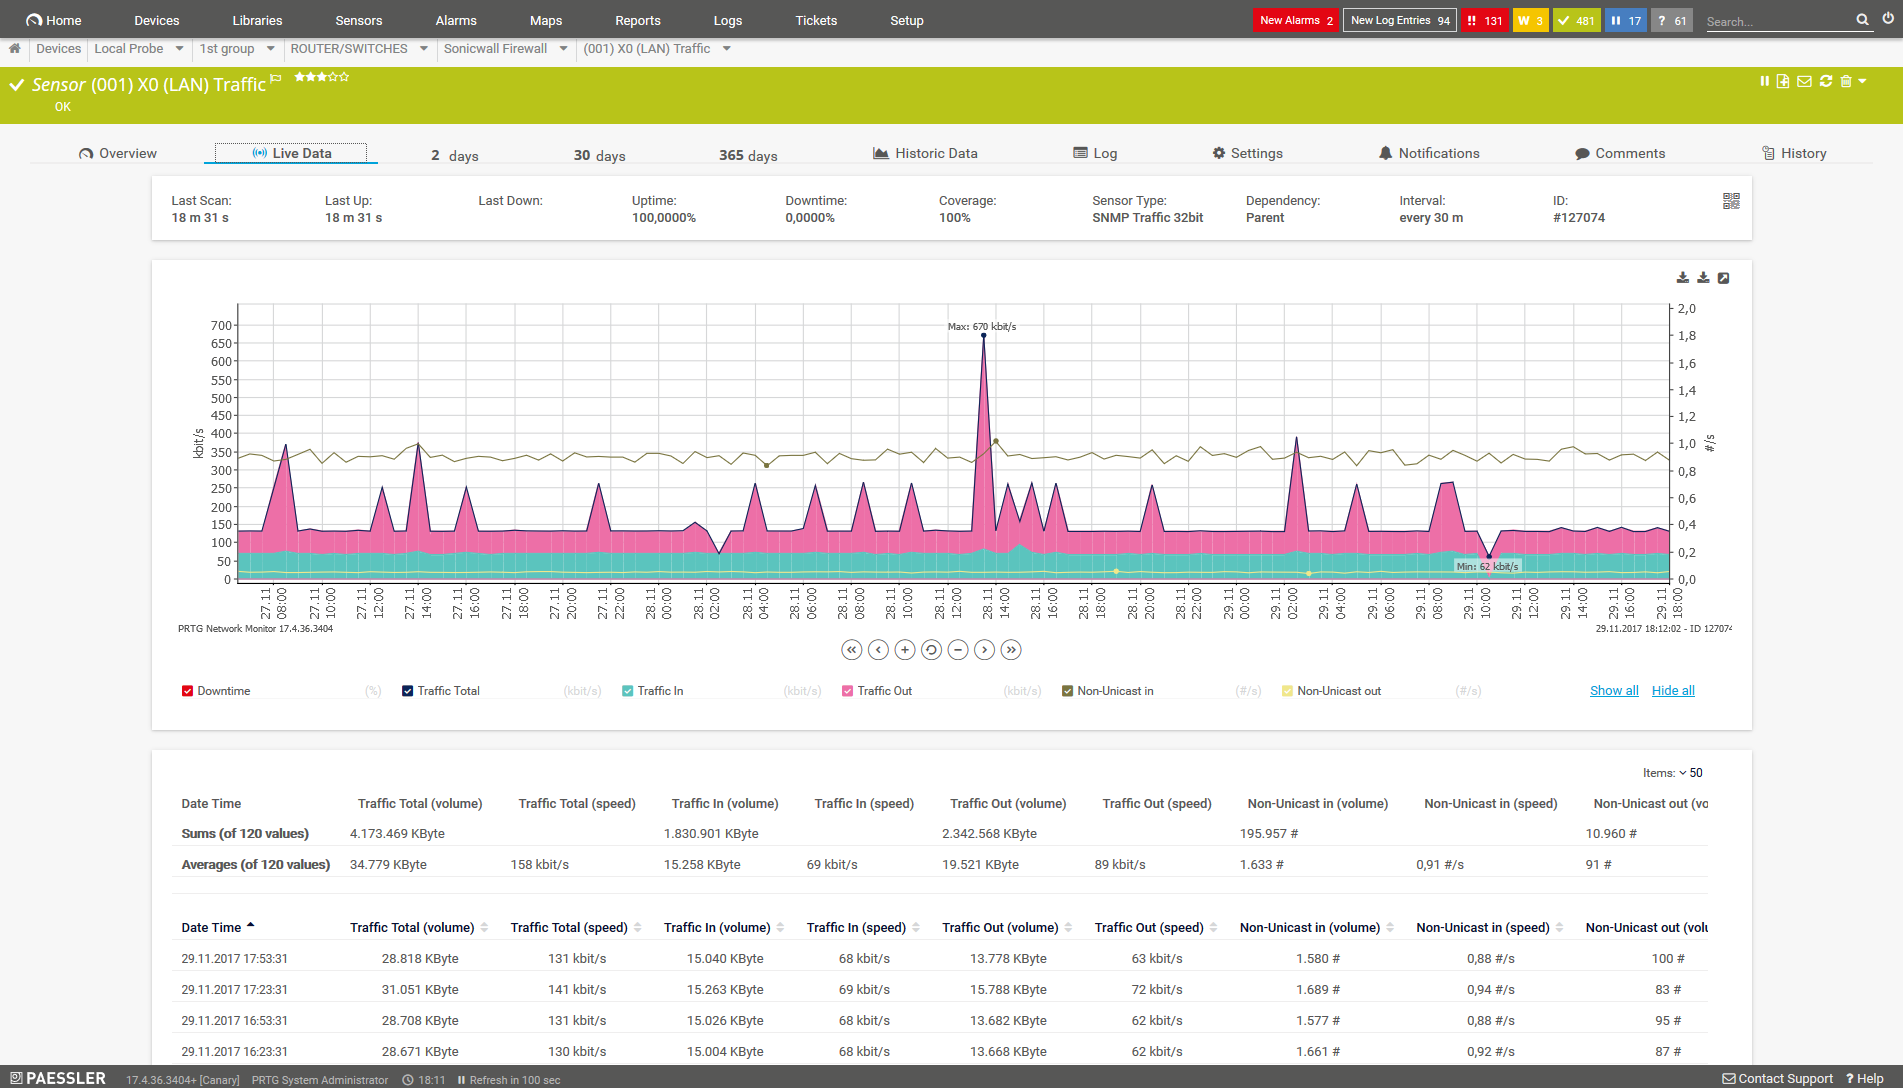
Traffic live
30 days overview
PRTG alerts you before problems occur
In the case of "classic" web page monitoring, the administrator is first confronted with the effect and then has to find and solve the cause of the problem. The actual relationship between cause and effect is reversed; first the effect is received and then a cause is sought:
- Alarm: "The website is not reachable or reacts too slowly!"
- Research: "What are the causes of the failure and how can I eliminate it?"
But what if the cause is not so easy to find and therefore the problem cannot be solved quickly? Or can the sequence be reversed, with the cause known before the effect? For example, identify impending causes of problems in time and to proactively avoid the consequences?
Your way to IIS Monitoring
Let's go through the entire IIS Monitoring setup process step by step and define a few basic parameters.
Website loading time
Let us skip the simplest website monitoring from the beginnings of the Internet, where a ping to the website measures its response time (which is still important!). The pure reaction time of a website does not necessarily mean something about the user experience: After the first ping, the loading of the actual page can still be felt forever. PRTG monitors far more, such as the loading time of the source code or even the complete website including all content. Scripts are used to simulate logon processes or purchase processes and to measure response times. Other scripts can read and check individual values from a web page. For this purpose, PRTG also supports the monitoring of the various web servers like Apache, IIS and more.
Web server monitoring
If the company operates internationally, there is another, additional challenge: if the web server is operated in the USA and is accessible without delay from the USA, this does not mean that customers from Europe or Asia also have fast access. In this case, the monitoring solution must allow monitoring of the web page from globally distributed locations. This only gives the administrator the information that something is wrong. What is not working properly is the next question he has to answer.
Application performance monitoring
Special tools for monitoring web applications, so-called application performance monitoring or APM tools, go a step further and analyze the source code of the web application. In addition to ongoing monitoring, this is mainly the cause of research on causes. However, this is only about the causes within the application, which primarily concerns Dev-Ops and are mainly relevant for the development of the website. The administrator, who is responsible for the day-to-day operation of the website, needs other tools like PRTG for his research to be successful.
Beyond the web application
Web servers and databases provide code and data, load balancers control data streams, firewalls form security locks, and switches and routers distribute data that often travels over many stations from one location to another. This is a complex thing whose response time depends on far more than only source code. This includes physical computing units with components such as CPU or memory, or virtualized environments (VMware or Hyper-V), which in turn depend on the underlying hardware. Many applications, such as web servers like IIS and databases, also have a great impact on the performance of a website. PRTG monitors everything at a glance.
Avoid problems in the beginning
If the website responds slowly, each individual component can be the cause. The search for the error is complex and time consuming.
The best way is to avoid errors before they occur.
The recipe for this is IT monitoring or unified monitoring as an extension of network monitoring. If you constantly monitor all components involved in the publication process of a website with PRTG, you can identify and anticipate impending problems in advance: in the ideal case before any kind of impairment of the online appearance occurs. In the long term, systems and processes can be optimized based on historical monitoring data, thus improving the reliability and overall performance of the website on a sustained basis.
![]() Ping is a command-line utility, available on virtually any operating system with network connectivity, that acts as a test to see if a networked device is reachable. The ping command sends a request over the network to a specific device. A successful ping results in a response from the computer that was pinged back to the originating computer.
Ping is a command-line utility, available on virtually any operating system with network connectivity, that acts as a test to see if a networked device is reachable. The ping command sends a request over the network to a specific device. A successful ping results in a response from the computer that was pinged back to the originating computer.
Read more
Trusted by 500,000 users and recognized
by industry analysts as a leader

“Fantastic network and infrastructure monitoring solution that is easy to deploy and easier still to use. Simply the best available.”

“Software is absolutely perfect, Support is superior. Meets all needs and requirements, this is a must have solution if you are needing any form of monitoring.”

“The tool excels at its primary focus of being a unified infrastructure management and network monitoring service.”
Create innovative solutions with Paessler’s partners
Partnering with innovative vendors, Paessler unleashes synergies to create
new and additional benefits for joined customers.


ScriptRunner
With ScriptRunner, Paessler integrates a powerful event automation platform into PRTG Network Monitor.
Why you should rely on PRTG for IIS Monitoring
![]() How PRTG defines sensors
How PRTG defines sensors
In PRTG, “sensors” are the basic monitoring elements. One sensor usually monitors one measured value in your network, e.g. the traffic of a switch port, the CPU load of a server, the free space of a disk drive. On average you need about 5-10 sensors per device or one sensor per switch port.
For the correct choice of the monitoring solution it is necessary to consider a whole series of aspects. First of all, the software must include all functions for direct monitoring of the website, and features for monitoring the entire infrastructure involved in the publishing process. Very important are also general functions, which stand for flexibility and usability and form an essential basis for the successful use. And last but not least, price and licensing play an essential role in decision-making.
PRTG combines all advantages and aspects of a professional IIS Monitoring tool - Out of the box:
![]()
Features
- Website monitoring via ping
- Monitoring the loading time for the complete page
- Transaction monitoring
- Web server monitoring (Microsoft Internet Information Services IIS, Apache)
- Email monitoring
- Monitoring the website of globally distributed sites
- Monitoring Windows Performance Counters and locate network bottlenecks
- Individual dashboards and great visualizations of all important performance metrics
- Preconfigured sensors like PerfCounter IIS Application Pool Sensor or Windows IIS 6.0 SMTP Received Sensor
- Out-of-box monitoring of common devices (servers, switches, routers ...) and applications (databases, firewalls ...)
- Support of standard protocols for monitoring data streams (SNMP, NetFlow, IPFIX, Packet Sniffing ...)
- Monitor virtual applications (VMware, Hyper-V, Citrix)
![]()
Functions
- Documented API and templates for the simple creation of own queries, if possible also for the web application itself
- Comprehensive notification and alerting functions
- Simple and versatile publication process for monitoring data
- Storage of the monitoring data in the original interval for precise long-term evaluations
![]()
Important aspects
- Ease of use
- Simple and transparent licensing
- Free trial and great Price-performance ratio
PRTG makes your job easier
Our monitoring software frees you to focus on other tasks by promptly notifying you of potential issues.
![]()
Save effort
PRTG gives you one central monitoring tool for your servers and entire network. Enjoy a quick overview of your whole infrastructure via our dashboard and app.
![]()
Save time
Getting started with PRTG is a breeze. Setting up or switching from another network monitoring tool is easy thanks to the auto-discovery and pre-configured device templates.
![]()
Save money
80% of our customers report substantial cost savings with network monitoring. Your costs of licenses will likely pay for themselves within weeks.
“Easy to implement and configure with good technical support.”
R. v. S., ICT Manager at Heinen & Hopman Eng BV

PRTG: The multi-tool for sysadmins
Adapt PRTG individually and dynamically to your needs and rely on a strong API:- HTTP API: Access monitoring data and manipulate monitoring objects via HTTP requests
- Custom sensors: Create your own PRTG sensors for customized monitoring
- Custom notifications: Create your own notifications and send action triggers to external systems
- REST Custom sensor: Monitor almost everything that provides data in XML or JSON format
Still not convinced?
![]()
More than 500,000 sysadmins love PRTG
Paessler PRTG is used by companies of all sizes. Sysadmins love PRTG because it makes their job a whole lot easier.
Still not convinced?
![]()
Monitor your entire IT infrastructure
Bandwidth, servers, virtual environments, websites, VoIP services – PRTG keeps an eye on your entire network.
![]()
Try Paessler PRTG for free
Everyone has different monitoring needs. That’s why we let you try PRTG for free. Start now with your trial.
|
PRTG |
Network Monitoring Software - Version 24.2.94.1400 (April 10th, 2024) |
|
Hosting |
Download for Windows and cloud-based version PRTG Hosted Monitor available |
Languages |
English, German, Spanish, French, Portuguese, Dutch, Russian, Japanese, and Simplified Chinese |
Pricing |
Up to 100 sensors for free (Price List) |
Unified Monitoring |
Network devices, bandwidth, servers, applications, virtual environments, remote systems, IoT, and more |
Supported Vendors & Applications |
|
Combining the broad monitoring feature set of PRTG with IP Fabric’s automated network assurance creates a new level of network visibility and reliability.