![]()
Docker monitoring with PRTG
For the reliable management of dockerized applications

PRTG comes with ready-to-use Docker sensors – at no extra charge
Optimize the availability and performance of Docker containers
Minimize errors during the management/deployment of applications
What is Docker monitoring?
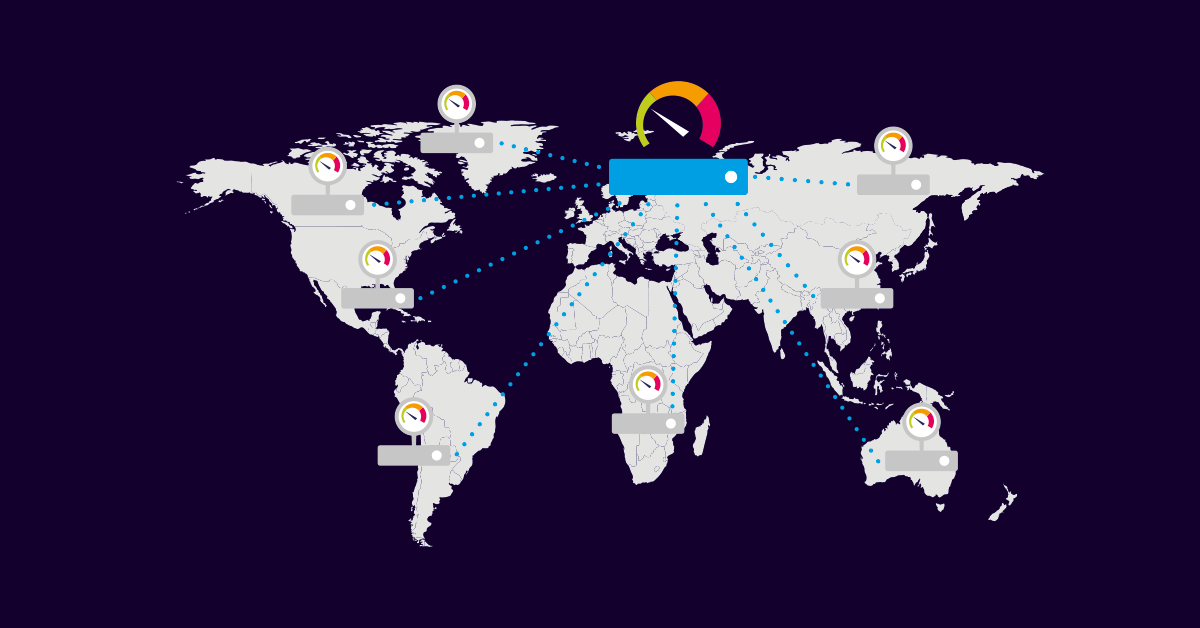
Centralized application monitoring for your Docker containers
![]()
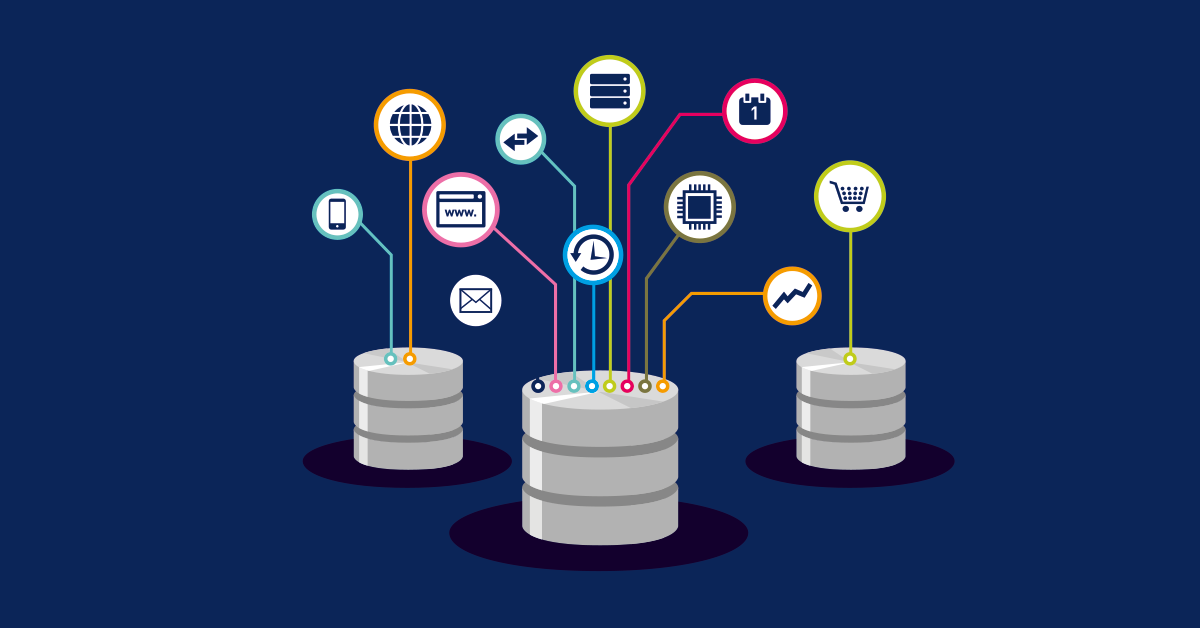
Quick and easy container platform
Docker is gaining in popularity as a quick and easy container platform. One of the reasons network administrators love Docker technology is that it facilitates the separation of applications from the corporate infrastructure. If a hacker gains admin access via an application, he/she remains trapped inside the container – and the company network stays secure.
Docker packs applications (along with their dependencies and configurations) into containers, thereby making it easier to distribute them to all the employees of a firm. When applications are isolated inside a separate container infrastructure, the surrounding system is protected from hacks, no matter where the system happens to be.
![]()
An overview of all containers
Docker containers allow developers to develop in one place without interruption, to test, to manage workloads and important components, and to deploy new applications. These functions should work flawlessly for each of your containers! PRTG Docker monitoring helps by providing a constant overview of all your containers.

![]()
Special sensor for Docker environments
To reap maximum efficiency, security, and savings from Docker, you’ll need to monitor the availability and performance of its containers. There’s no need to purchase additional software - PRTG features a special, preconfigured sensor for Docker environments. This sensor lets you reliably manage and deploy dockerized applications.
With PRTG, everyone will work with peace of mind.
An introduction to Docker monitoring with PRTG
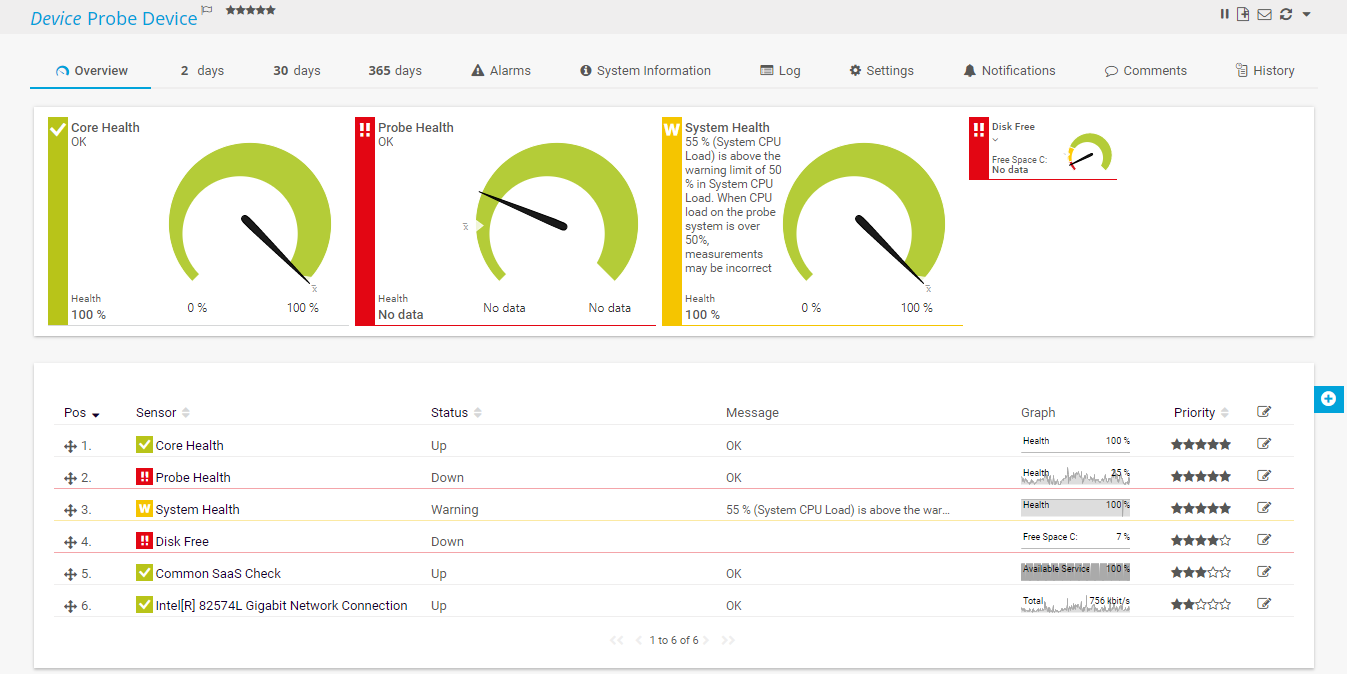
Device overview
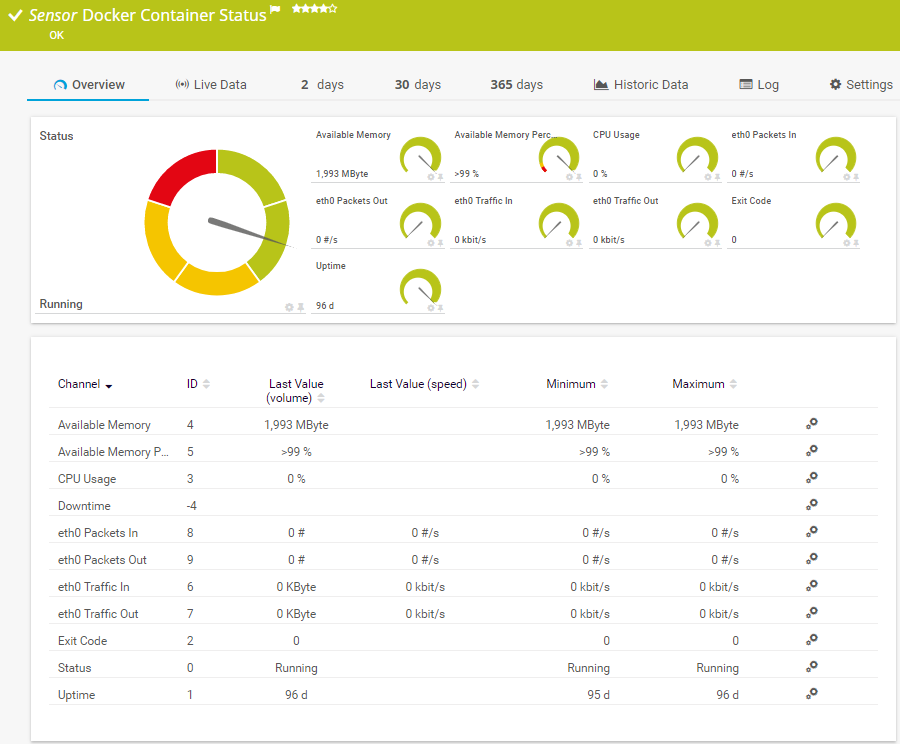
Sensor Docker Container Status
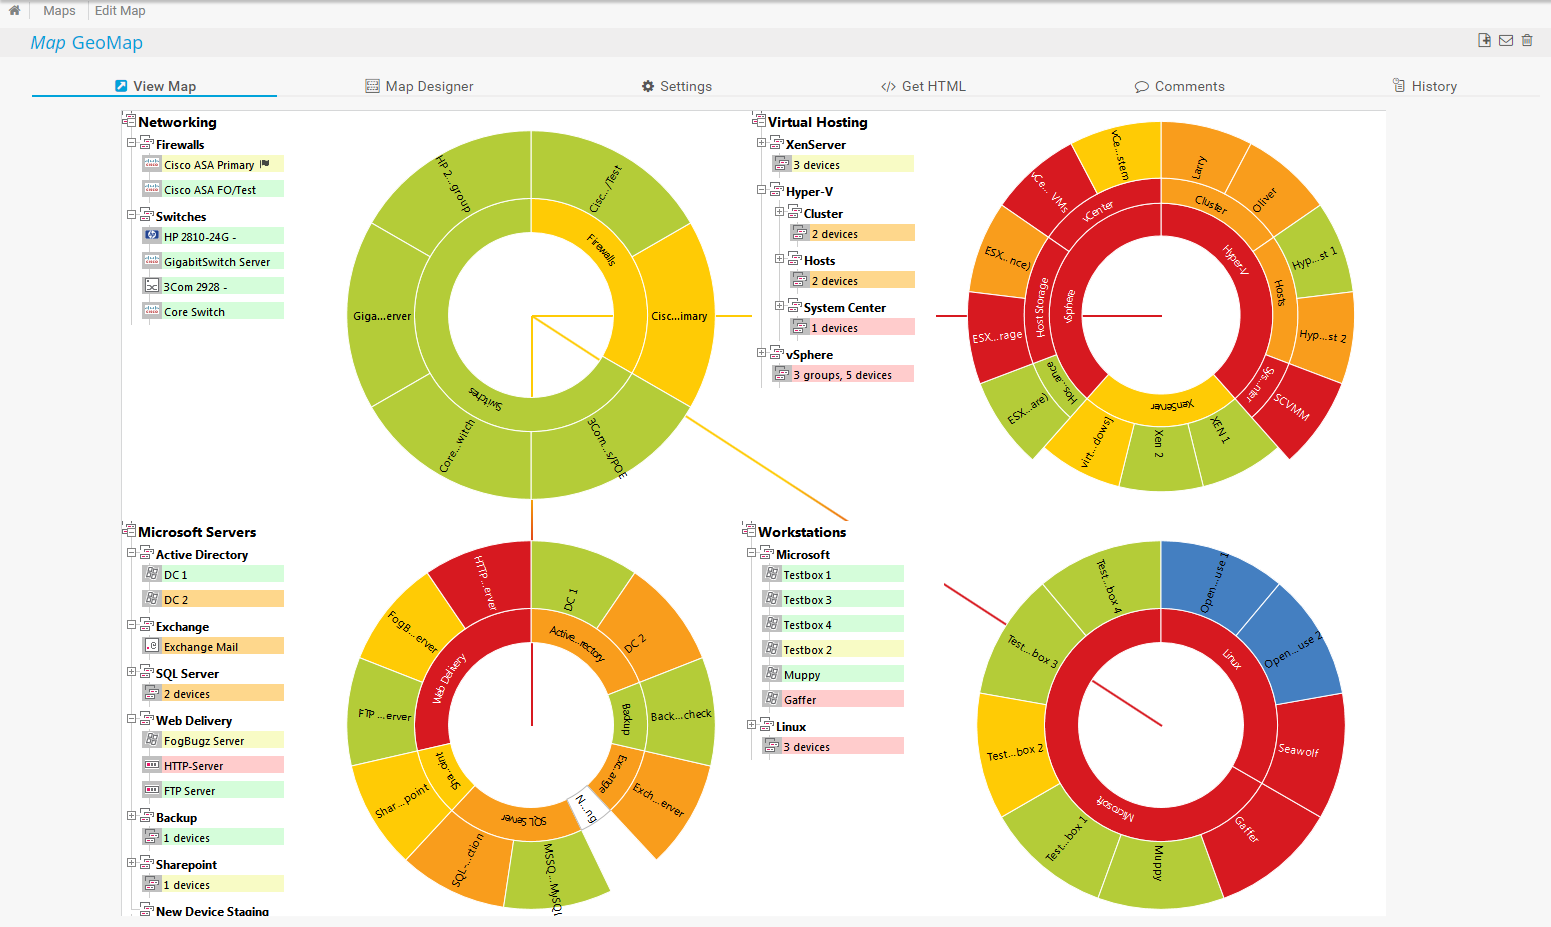
Your network at a glance
How Docker monitoring with PRTG works
![]() How PRTG defines sensors
How PRTG defines sensors
In PRTG, “sensors” are the basic monitoring elements. One sensor usually monitors one measured value in your network, e.g. the traffic of a switch port, the CPU load of a server, the free space of a disk drive. On average you need about 5-10 sensors per device or one sensor per switch port.
Monitoring
PRTG comes equipped with a special sensor for monitoring Docker containers. This sensor displays the statuses of your containers and provides you with regular updates. If necessary, it will also sound the alarm!
Secure connection
Select the desired container while creating a sensor, or configure sensors to monitor several containers at the same time. To do so, you’ll need a private key and certificate. Only then can you establish a secure connection from Docker to PRTG.
User-defined
The Docker Container Status Sensor uses lookups to determine the status values of one or more sensor channels. The possible statutes are defined in the corresponding lookup file. The behavior of a Docker Container Status sensor channel can be changed by editing these files.
Additional information
How can I create a private key and certificate for the Docker Container Status Sensor?
Define lookups
Immediately see if your containers are available – even while on the go
Set up PRTG in minutes and use it on almost any mobile device.


6 reasons to choose PRTG as your Docker monitoring tool
![]()
All-in-one tool
All new software comes with potential risks, which can include anything from compatibility to security issues. PRTG is an all-in-one monitoring tool that includes a special built-in sensor for Docker monitoring. That means you can do away with having to rely on a variety of individualized solutions.
![]()
Stability
Docker technology allows for applications to be isolated in containers. For network administrators, these containers are secure and stable parts of their IT infrastructures which contribute to the overall stability of their company’s operations.
![]()
Control
Docker monitoring lets you oversee the deployment of dockerized applications to workstations in a number of different locations. If errors arise, you can intervene at once.
![]()
Clarity
Display the statuses of your Docker containers on an easy-to-read dashboard. Customize the dashboard, alarm, and reports feature – for yourself and the other stakeholders.
![]()
Responsiveness
PRTG sounds the alarm automatically – according to parameters defined by you beforehand – as soon as containers malfunction or performance problems arise. You can choose from any of the following alarm types: SMS, email, push notification, and more.
![]()
Automated reporting
PRTG monitoring helps companies ensure their Docker containers maintain an acceptable level of performance. Automated reports can be sent to the management team for this purpose.
PRTG makes your job easier
Our monitoring software frees you to focus on other tasks by promptly notifying you of potential issues.
![]()
Save effort
PRTG gives you one central monitoring tool for your servers and entire network. Enjoy a quick overview of your whole infrastructure via our dashboard and app.
![]()
Save time
Getting started with PRTG is a breeze. Setting up or switching from another network monitoring tool is easy thanks to the auto-discovery and pre-configured device templates.
![]()
Save money
80% of our customers report substantial cost savings with network monitoring. Your costs of licenses will likely pay for themselves within weeks.
Trusted by 500,000 users and recognized
by industry analysts as a leader
by industry analysts as a leader

“Fantastic network and infrastructure monitoring solution that is easy to deploy and easier still to use. Simply the best available.”

“Software is absolutely perfect, Support is superior. Meets all needs and requirements, this is a must have solution if you are needing any form of monitoring.”

“The tool excels at its primary focus of being a unified infrastructure management and network monitoring service.”
“Easy to implement and configure with good technical support.”
R. v. S., ICT Manager at Heinen & Hopman Eng BV

“I particularly like having breakfast at home and just surveying my domain, and understanding what's working and what isn't.”
Steve Coppin, Oxford University


PRTG: The multi-tool for sysadmins
Adapt PRTG individually and dynamically to your needs and rely on a strong API:- HTTP API: Access monitoring data and manipulate monitoring objects via HTTP requests
- Custom sensors: Create your own PRTG sensors for customized monitoring
- Custom notifications: Create your own notifications and send action triggers to external systems
- REST Custom sensor: Monitor almost everything that provides data in XML or JSON format


We asked: would you recommend PRTG?
Over 95% of our customers say yes!
Paessler AG conducted trials in over 600 IT departments worldwide to tune its network monitoring software closer to the needs of sysadmins.
The result of the survey: over 95% of the participants would recommend PRTG – or already have.

Still not convinced?
![]()
More than 500,000 sysadmins love PRTG
Paessler PRTG is used by companies of all sizes. Sysadmins love PRTG because it makes their job a whole lot easier.
Still not convinced?
![]()
Monitor your entire IT infrastructure
Bandwidth, servers, virtual environments, websites, VoIP services – PRTG keeps an eye on your entire network.
![]()
Try Paessler PRTG for free
Everyone has different monitoring needs. That’s why we let you try PRTG for free. Start now with your trial.
|
PRTG |
Network Monitoring Software - Version 24.2.94.1400 (April 10th, 2024) |
|
Hosting |
Download for Windows and cloud-based version PRTG Hosted Monitor available |
Languages |
English, German, Spanish, French, Portuguese, Dutch, Russian, Japanese, and Simplified Chinese |
Pricing |
Up to 100 sensors for free (Price List) |
Unified Monitoring |
Network devices, bandwidth, servers, applications, virtual environments, remote systems, IoT, and more |
Supported Vendors & Applications |
|
Combining the broad monitoring feature set of PRTG with IP Fabric’s automated network assurance creates a new level of network visibility and reliability.