![]()
Monitor and optimize
your CDN with PRTG

PRTG monitors the
global distribution
of traffic
PRTG monitors the response times of
your CDN
PRTG notifies you
in the event of
fluctuations in traffic
PRTG shows detailed data of all CDN nodes, origin servers, and involved components
CDN monitoring with PRTG
CDN monitoring: Keep an eye on the global response times of your CDN
![]() How PRTG defines sensors
How PRTG defines sensors
In PRTG, “sensors” are the basic monitoring elements. One sensor usually monitors one measured value in your network, e.g. the traffic of a switch port, the CPU load of a server, the free space of a disk drive. On average you need about 5-10 sensors per device or one sensor per switch port.
Without a content delivery network, it is difficult to maintain the user-friendliness, cost-effectiveness, and performance of globally-distributed websites and web applications. By distributing content to several different replica servers, you can promptly process hits, detect peak loads, and scale demand. PRTG is used to monitor content delivery networks (CDNs).
CDN monitoring with PRTG offers you an overview of traffic distribution between international DN nodes, as well as information on traffic strength, response times, and potential weak spots. You'll also gain valuable insight into the relationship between costs and speed. CDN monitoring can be used to make informed decisions on the future development and optimization of your CDN.
Monitor your CDN and the customer experience
To ensure a properly working CDN, it is not only important to directly monitor the CDN nodes and connections. You also have to closely watch your origin servers, because any increase in server data might indicate a malfunctioning CDN. With PRTG you can retrieve important data of the origins like the overall load on the server, CPU usage, or the numbers of pages served. In the same way you should monitor all involved hardware components between the CDN and your origin servers. Your CDN might not work as desired if there is strange behavior like high load und errors on load balancers, firewalls, or web servers, or if all traffic is coming to your origins. PRTG can monitor all necessary parameters and will immediately notify you in such cases.
Additionally, keep an eye on what your customers experience when visiting your web pages. For example, use the PRTG cloud sensors to measure ping and HTTP loading times of your web pages from various locations around the globe. With PRTG, you can also set up automatic content checks for your web pages: for example, ensure that all locations are really showing the new version after an update of a web page.
Customize CDN Monitoring with PRTG
If you have programming experience, you can perfectly adapt the CDN monitoring with PRTG to get an even closer view on your CDN. For example, write a script and use custom sensors to read out the CDN log with PRTG. Doing so you will immediately see if there are any errors. Or, if your CDN provider has an API, write a custom script to monitor accessible CDN parameters. With PRTG you can monitor exactly what you need!
With PRTG, administrators get an overview of their CDN, website visitors are given the best possible online experience, and managers obtain an optimized conversion rate and reliable figures for the expansion of their CDN. Improve the performance of your CDN, and solve problems before they arise.
Thanks to PRTG, everyone will work with peace of mind.
PRTG collects the following data
- Bandwidth for outstanding CDN endpoints
- Latency
- Global HTTP response times and response codes
- Global ping times
- Content checks in all locations
- Logs of the CDN
- Detailed data of the origin servers like load, CPU usage, number of pages served
- Detailed data of all components between CDN and origin servers: load balancers, firewalls, web servers, traffic
- Possibility to retrieve data via the API of your CDN provider (if available)
An introduction to CDN monitoring with PRTG
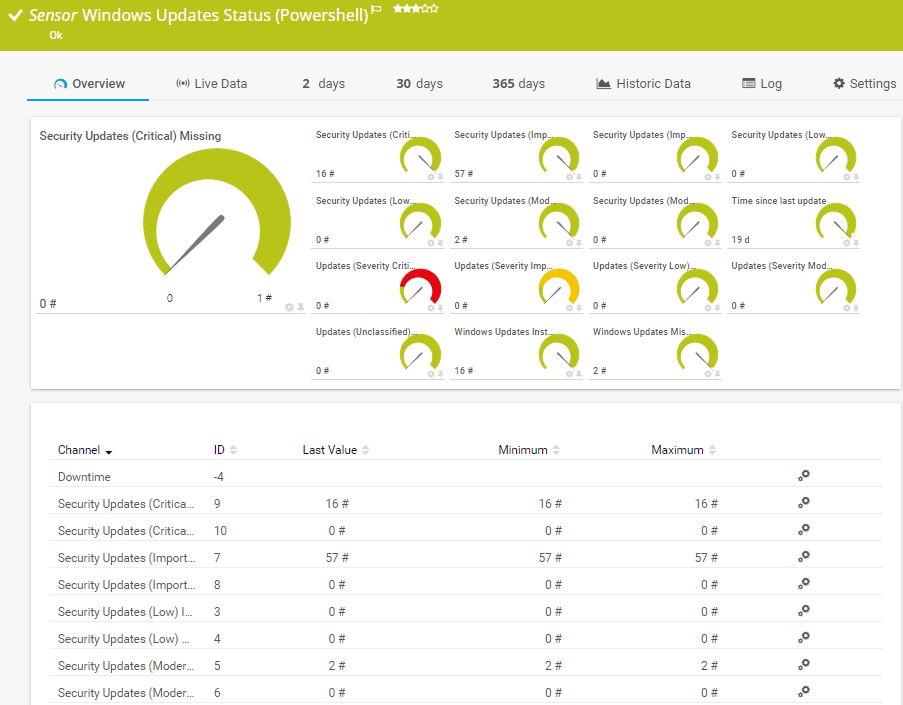
Overview of the Windows Update Status (Powershell) sensor
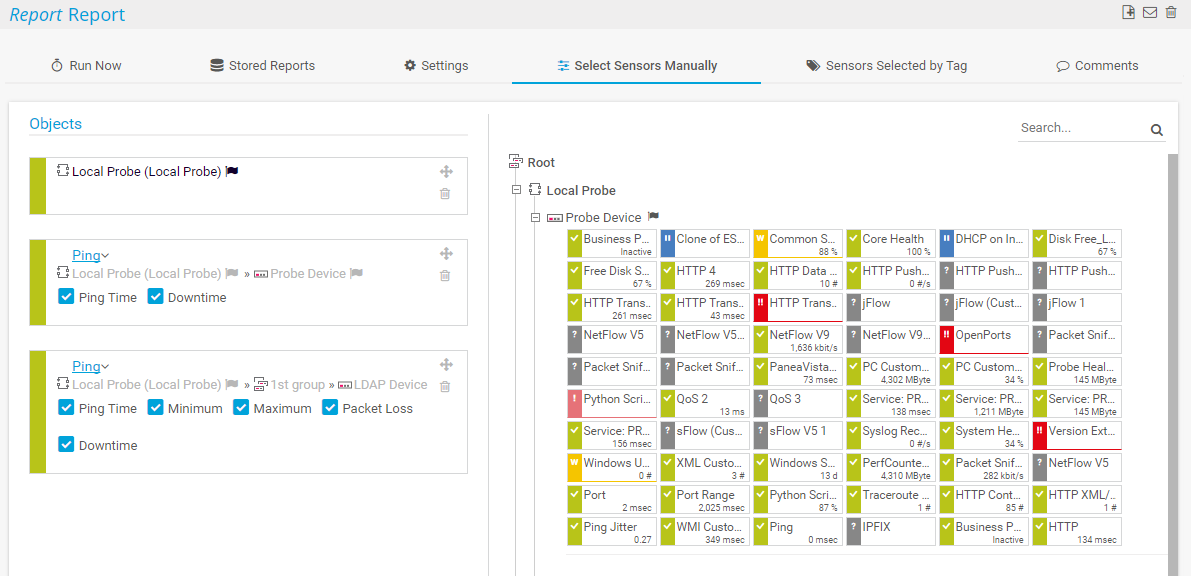
Report sensor selection

Your entire Web Servers at a glance
Your CDN Monitoring at a glance – even on the go
Set up PRTG in minutes and use it on almost any mobile device.


This is how CDN monitoring with PRTG works
A CDN is a network of regionally-distributed servers which uses its storage capacities to mirror your contents locally. Requests can therefore be answered more quickly by a nearby replica server than by a remote original server.
PRTG CDN monitoring keeps an eye on load balance and checks regional traffic for stability, uptime, speed, and bandwidth consumption, and you can check your origin servers and all components on the way from and to the CDN for unwanted behavior and errors. Alarms can be configured in such a way that the administrator is immediately informed when preset thresholds fall below or exceed a certain value.
6 good reasons to choose PRTG as your Dell monitoring tool
![]()
An enhanced overview
Enjoy a quick and easy overview of individual DN nodes, your origin servers, server performance, regional traffic, and the performance of your CDN – all from the comfort of your dashboard.
![]()
Automatic notifications
If problems arise, you'll be informed immediately by email, SMS, push notification, or a customized alarm, wherever you happen to be.
![]()
An optimum online experience
With CDN monitoring, you’ll offer visitors to your website and potential customers a professional online experience, all the while optimizing your conversion rate and increasing sales.
![]()
Business security
CDN monitoring lets you identify unusual incidents and examine fluctuations in traffic. This means you can prevent critical errors and set up new capacities in a timely manner.
![]()
CDN structure analysis
With PRTG, you’ll find out how data traffic is structured in your CDN, and can develop appropriate solutions for content, referencing, and expansion.
![]()
Geographically-optimized referencing
Optimize search engine referencing by monitoring CDN hits according to node, country, and region, and ensure an acceptable webpage performance and an up-to-date content on all locations.
PRTG makes your job easier
Our monitoring software frees you to focus on other tasks by promptly notifying you of potential issues.
![]()
Save effort
PRTG gives you one central monitoring tool for your servers and entire network. Enjoy a quick overview of your whole infrastructure via our dashboard and app.
![]()
Save time
Getting started with PRTG is a breeze. Setting up or switching from another network monitoring tool is easy thanks to the auto-discovery and pre-configured device templates.
![]()
Save money
80% of our customers report substantial cost savings with network monitoring. Your costs of licenses will likely pay for themselves within weeks.
Markus Puke, Network Administrator, Schüchtermann Klinik, Germany![]()
“We can all work with greater peace of mind knowing
that our systems are constantly being monitored.”
We asked: would you recommend PRTG?
Over 95% of our customers say yes!
Paessler AG conducted trials in over 600 IT departments worldwide to tune its network monitoring software closer to the needs of sysadmins.
The result of the survey: over 95% of the participants would recommend PRTG – or already have.

Trusted by 500,000 users and recognized
by industry analysts as a leader

“Fantastic network and infrastructure monitoring solution that is easy to deploy and easier still to use. Simply the best available.”

“Software is absolutely perfect, Support is superior. Meets all needs and requirements, this is a must have solution if you are needing any form of monitoring.”

“The tool excels at its primary focus of being a unified infrastructure management and network monitoring service.”


“Easy to implement and configure with good technical support.”
R. v. S., ICT Manager at Heinen & Hopman Eng BV

PRTG: The multi-tool for sysadmins
Adapt PRTG individually and dynamically to your needs and rely on a strong API:- HTTP API: Access monitoring data and manipulate monitoring objects via HTTP requests
- Custom sensors: Create your own PRTG sensors for customized monitoring
- Custom notifications: Create your own notifications and send action triggers to external systems
- REST Custom sensor: Monitor almost everything that provides data in XML or JSON format

Learn more about PRTG
Packet Capture: PRTG analyzes data packets and displays the data packet loss rate. In the event a critical value is exceeded, you’ll automatically receive an alert. Read more about packet sniffing here.
Docker Monitoring: PRTG comes with ready-to-use Docker sensors. Optimize the availability and performance of Docker containers and minimize errors during the management and deployment of applications.
Still not convinced?
![]()
More than 500,000 sysadmins love PRTG
Paessler PRTG is used by companies of all sizes. Sysadmins love PRTG because it makes their job a whole lot easier.
Still not convinced?
![]()
Monitor your entire IT infrastructure
Bandwidth, servers, virtual environments, websites, VoIP services – PRTG keeps an eye on your entire network.
![]()
Try Paessler PRTG for free
Everyone has different monitoring needs. That’s why we let you try PRTG for free. Start now with your trial.
|
PRTG |
Network Monitoring Software - Version 24.2.94.1400 (April 10th, 2024) |
|
Hosting |
Download for Windows and cloud-based version PRTG Hosted Monitor available |
Languages |
English, German, Spanish, French, Portuguese, Dutch, Russian, Japanese, and Simplified Chinese |
Pricing |
Up to 100 sensors for free (Price List) |
Unified Monitoring |
Network devices, bandwidth, servers, applications, virtual environments, remote systems, IoT, and more |
Supported Vendors & Applications |
|